Trading journal
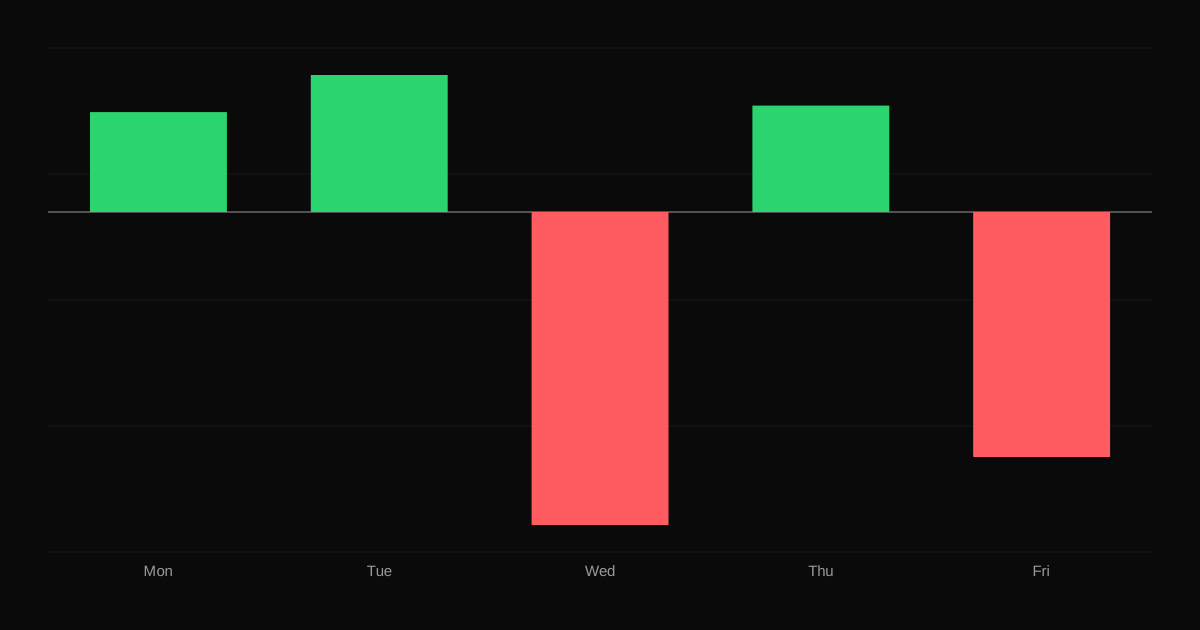
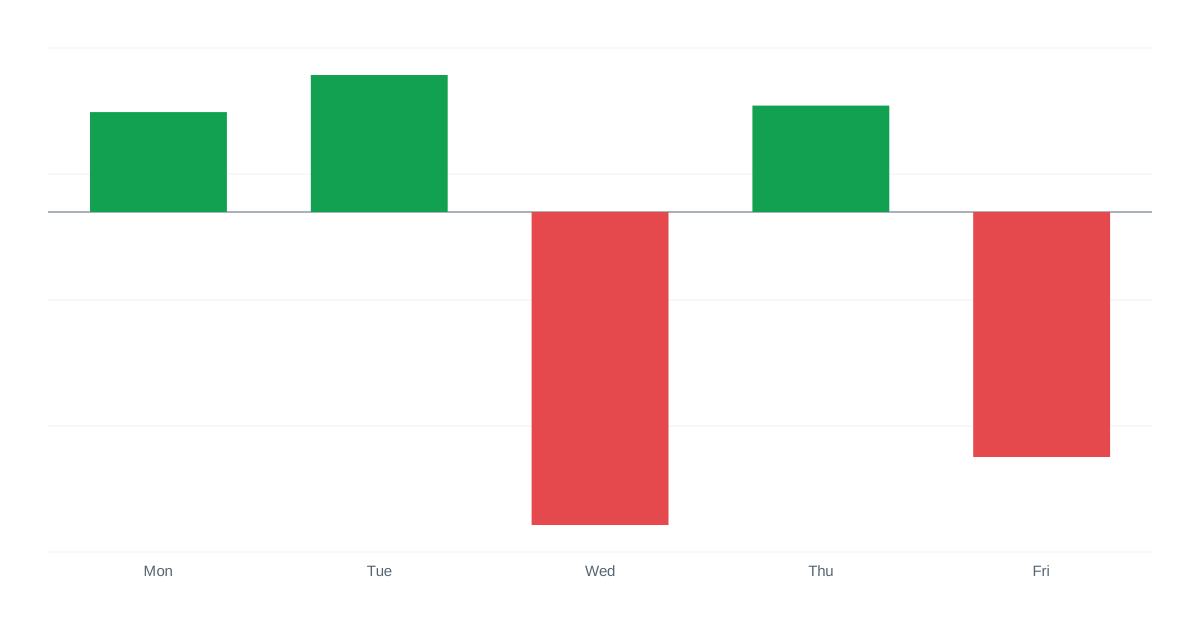
Day-of-Week Trading Performance: Do You Trade Worse on Mondays?
How to analyze your trading results by weekday, the common patterns traders find, and how to use them without overfitting.
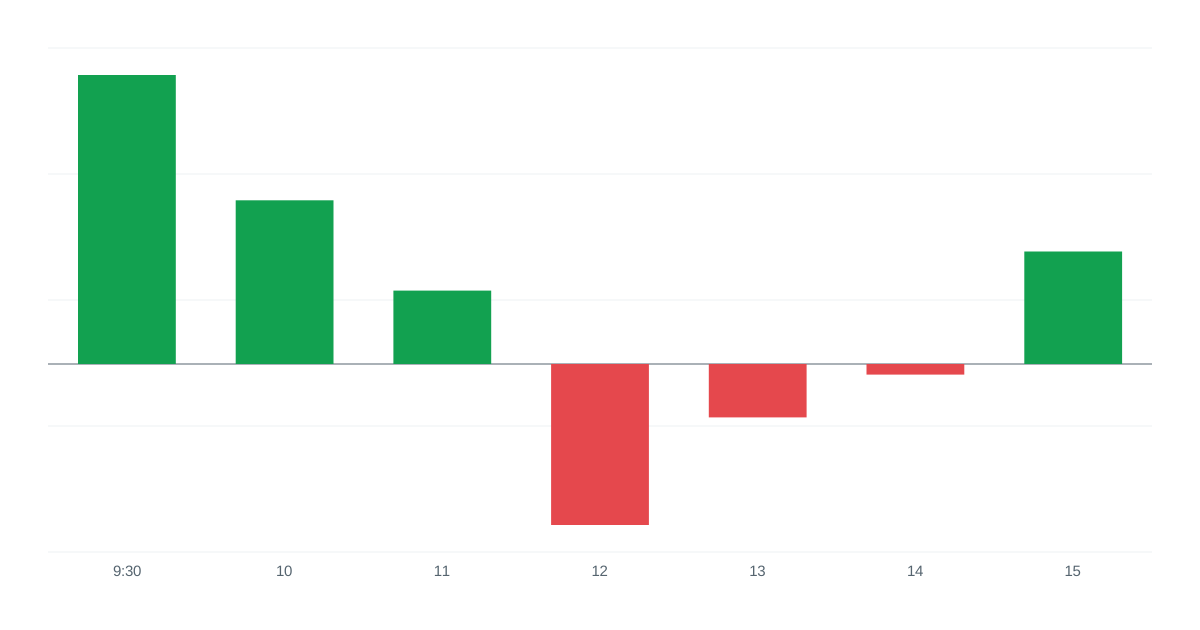
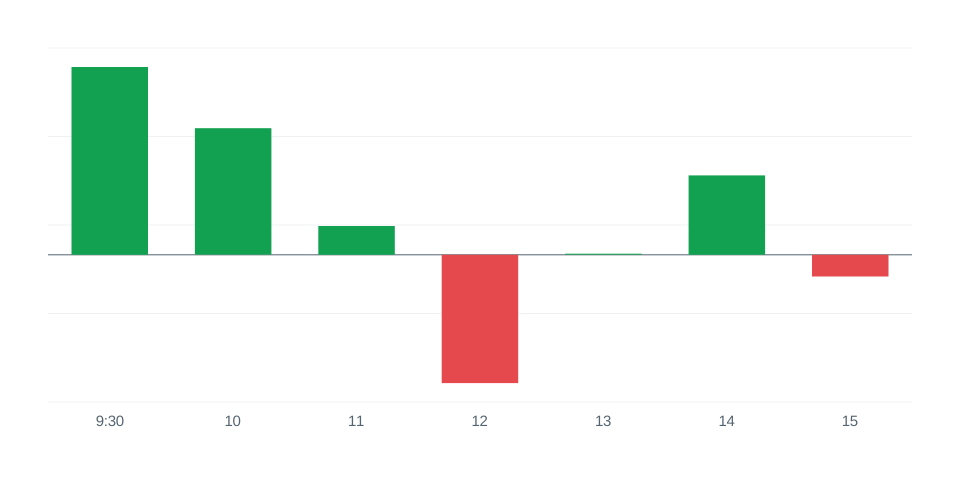
How to analyze your trading results by hour of the day, why most day traders do best in certain windows, and what to do with what you find.
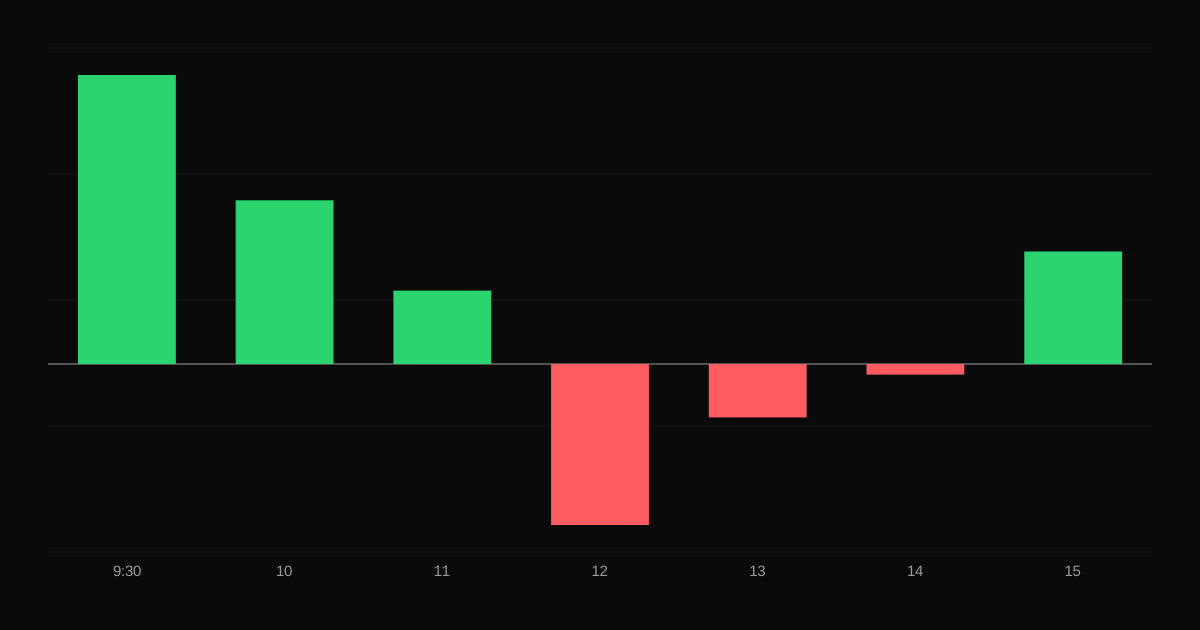
For many day traders, a large share of the profit comes from a small part of the day. The rest of the session often gives some or all of it back. Analyzing your results by entry hour is one of the fastest ways to improve, because the fix is simple: trade more in your good hours and less in your bad ones.
Market behavior changes through the session. In US stocks, for example:
Your personal results will depend on your style. A breakout trader may thrive at the open. A mean-reversion trader may do better at midday.
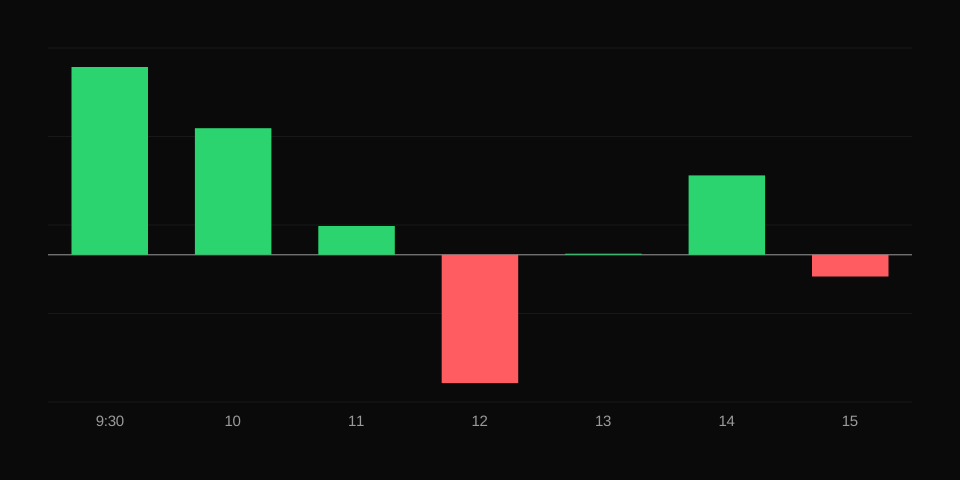
Look at both total P&L and average per trade. An hour with many small losing trades can quietly cost more than one big loss.
A related question is how long you hold. Some traders make money on trades held 5 to 30 minutes and lose on trades held for hours, often because they let losers run. Look at P&L by holding time next to time of day.
The reports page breaks results down by entry hour, weekday, month and holding time, with the number of trades for each bucket, so you can see at a glance where your edge is. Use filters to check whether the pattern holds for each setup separately.
How to analyze your trading results by weekday, the common patterns traders find, and how to use them without overfitting.
How a P&L calendar heatmap helps you spot losing streaks, overtrading and patterns in your trading, and what to look for when you review it.
A practical guide to keeping a trading journal: what to record, when to write, how to review it each week and how to turn your notes into better rules.