Strategy and analysis
How to Build a Trading Plan: A Step-by-Step Guide With Template
What a trading plan should include, from goals and markets to setups, risk rules, routines and review, with a template you can adapt.
How the opening range breakout strategy works, choosing the range length, entries, stops, targets, filters and how to measure whether ORB works for you.
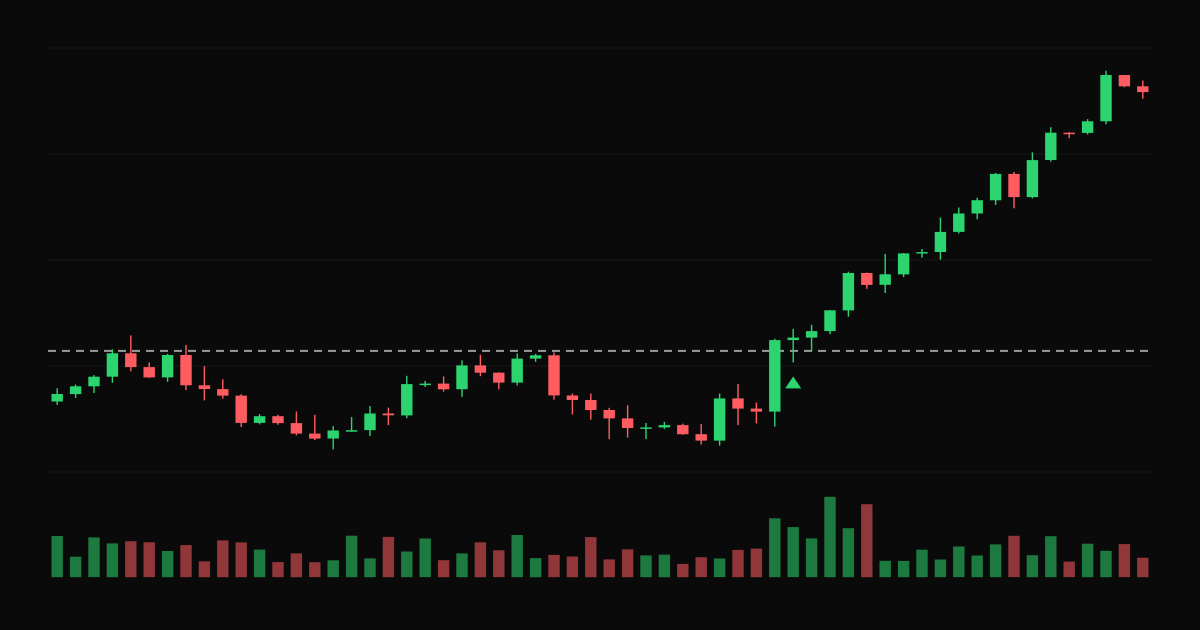
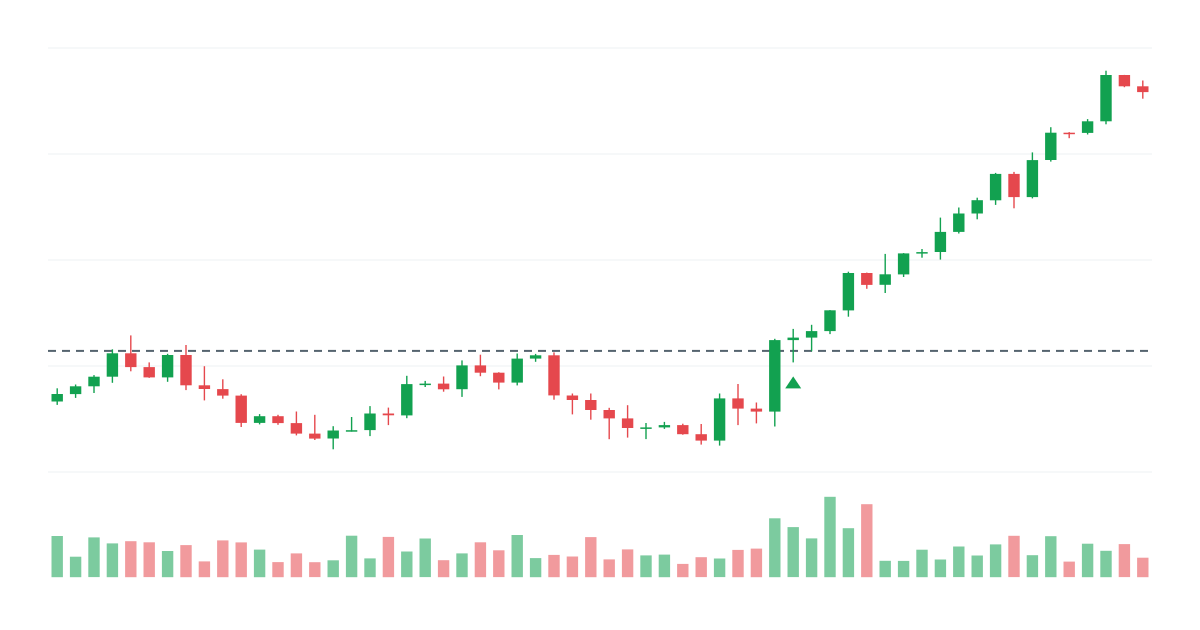
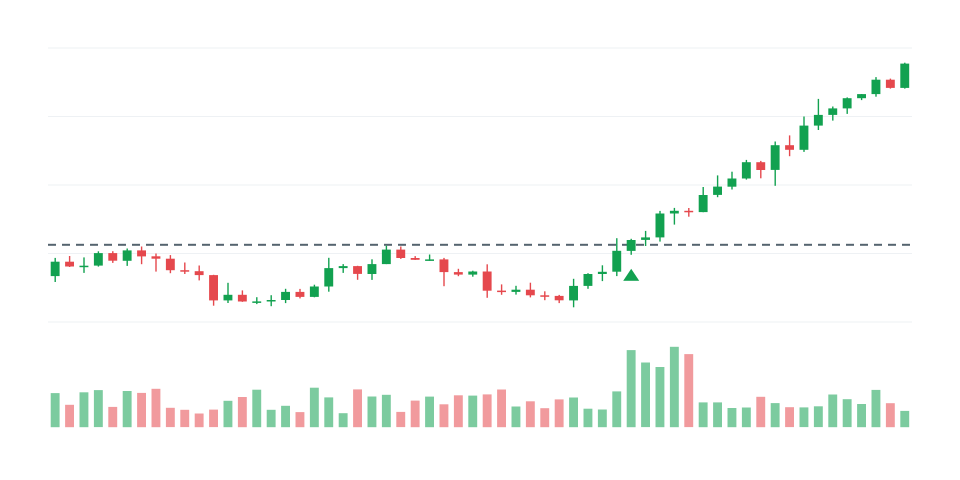
The opening range breakout (ORB) is a classic day trading strategy. You mark the high and low of the first minutes of the session, then trade a break above the high or below the low. The opening range often captures the market's first view of the day, and breaks from it can lead to strong moves.
Choose a fixed period after the open, commonly:
The range is the high and low of that period.
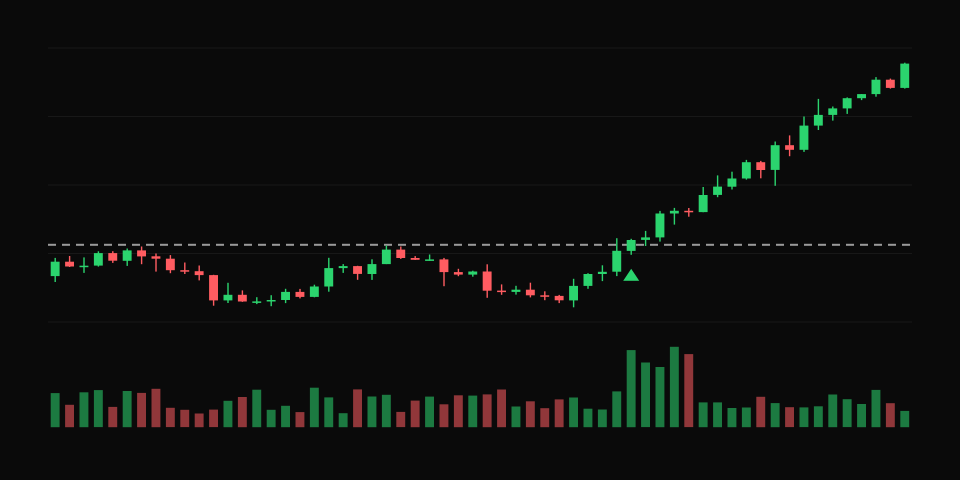
Because the stop distance depends on the range, sizes change every day. Use fixed risk per trade. See position sizing. A wide range might mean a small position, or no trade at all.
ORB is easy to measure because the rules are clear. Record the range length, the side, whether filters were met and the result in R. After 100 or more trades, compare expectancy by range length and filter. In TradeThink, the reports show results by setup and entry hour, and each trade's price chart shows exactly where you entered relative to the range.
What a trading plan should include, from goals and markets to setups, risk rules, routines and review, with a template you can adapt.
What backtesting tells you, what it cannot, why live trading results differ, and how a trading journal closes the gap between a strategy on paper and in practice.
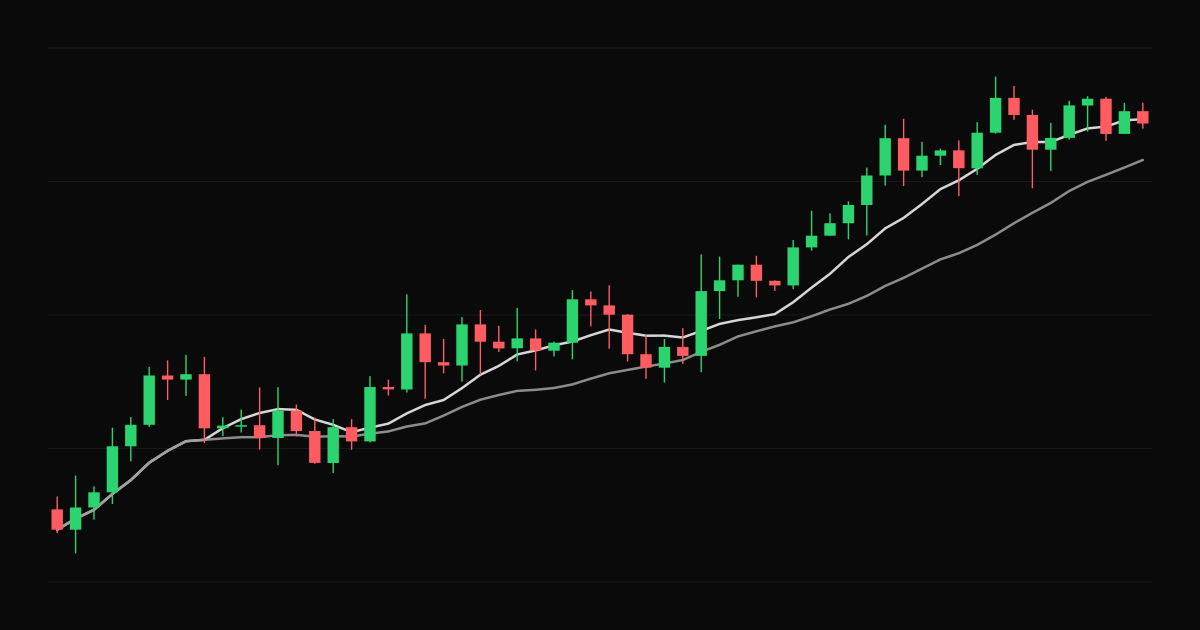
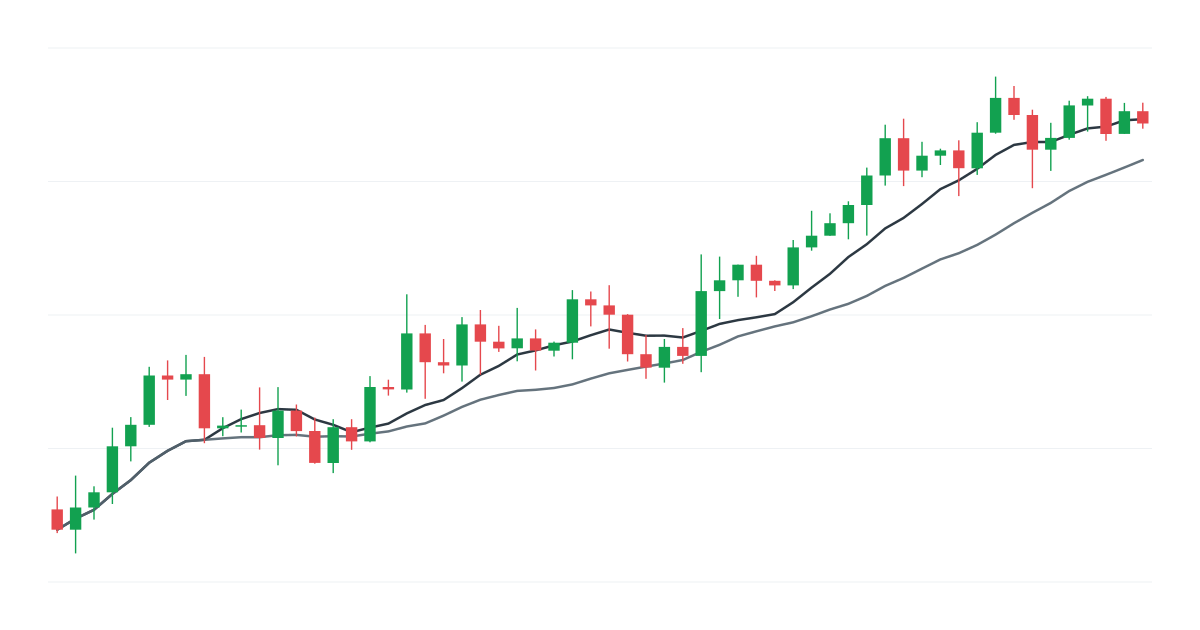
How traders use simple and exponential moving averages for trend direction, crossover signals, pullback entries and trailing stops, and the trade-offs of each approach.