Performance metrics
Holding Time Analysis: Are You Holding Losers Longer Than Winners?
How analyzing trade duration reveals hidden habits, why many traders hold losing trades longer than winners, and how to use holding time to improve exits.
Why small samples mislead traders, how the number of trades affects the reliability of win rate and expectancy, and how to use Monte Carlo simulation to test your edge.
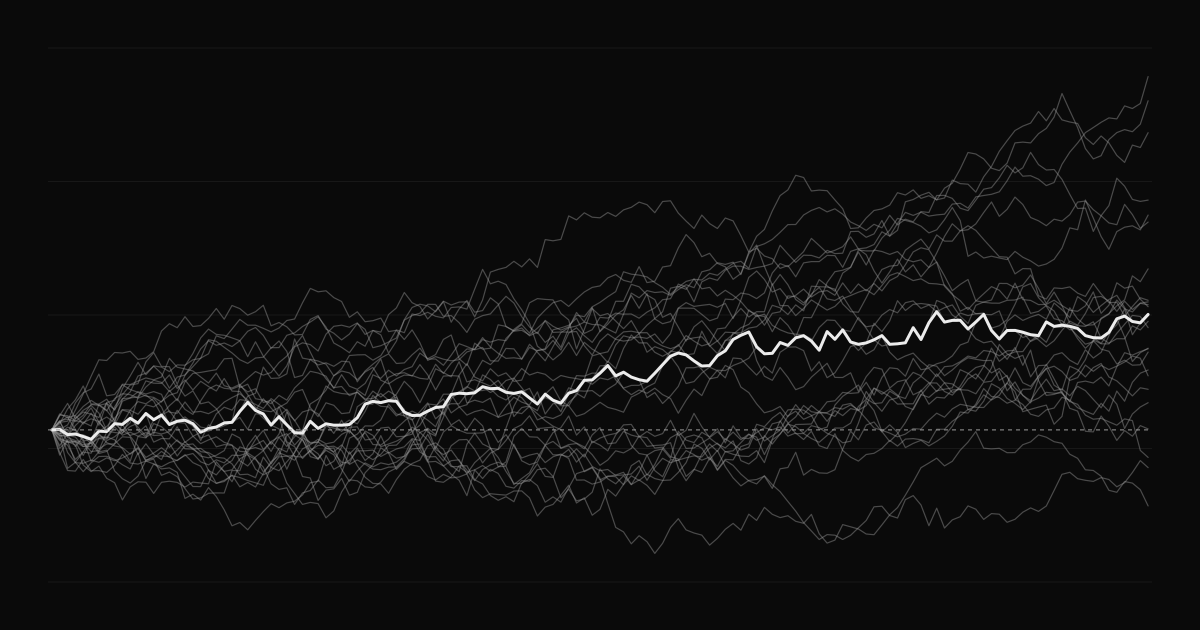
Ten winning trades in a row feels like proof. It is not. With small samples, luck can easily look like skill and skill can look like failure. Knowing how many trades you need before trusting a statistic saves you from abandoning good strategies and sticking with bad ones.
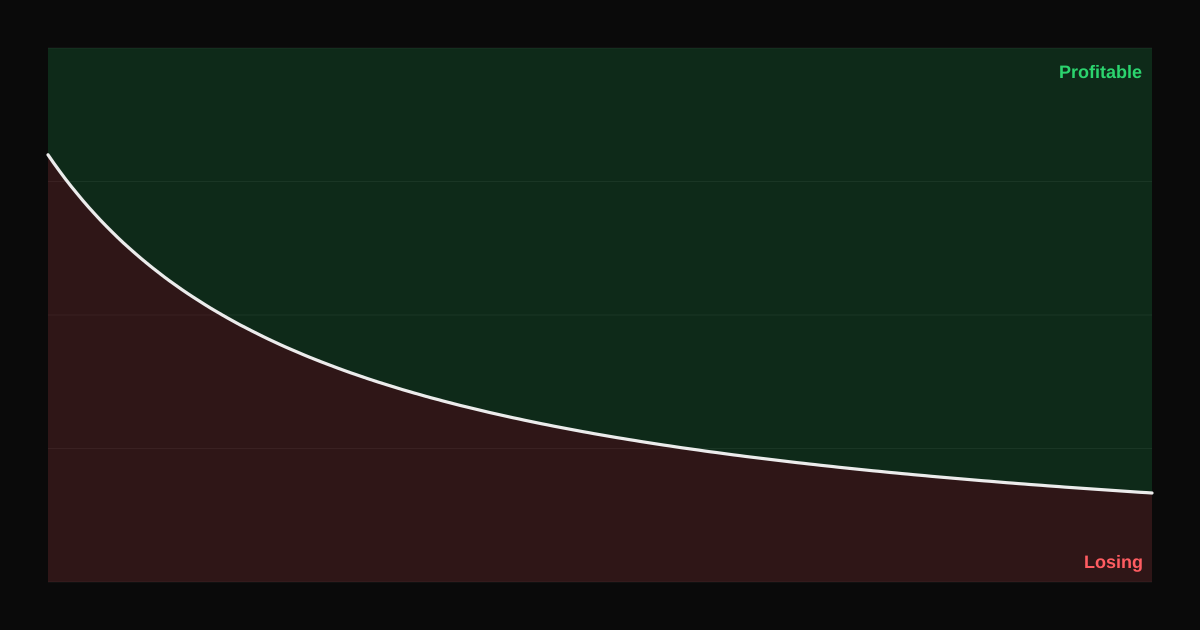
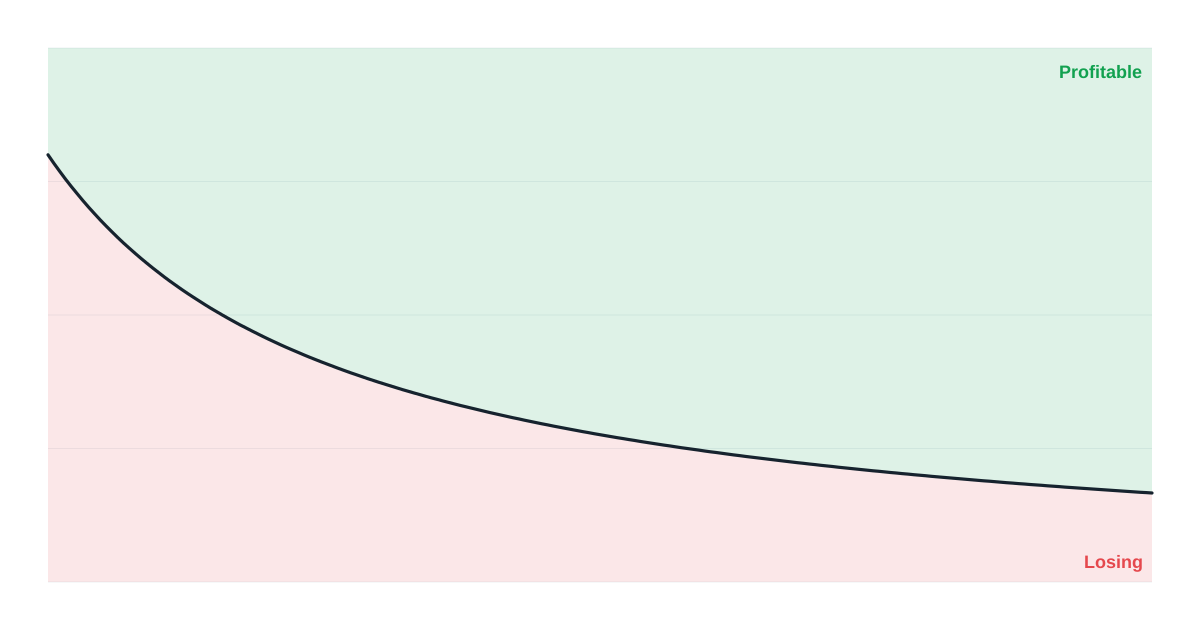
The uncertainty in a win rate shrinks with the square root of the number of trades. A rough 95% range for an observed win rate p over n trades is:
p ± 2 × √(p × (1 − p) ÷ n)
For an observed win rate of 55%:
| Trades | Approximate 95% range |
|---|---|
| 20 | 33% to 77% |
| 50 | 41% to 69% |
| 100 | 45% to 65% |
| 300 | 49% to 61% |
| 1,000 | 52% to 58% |
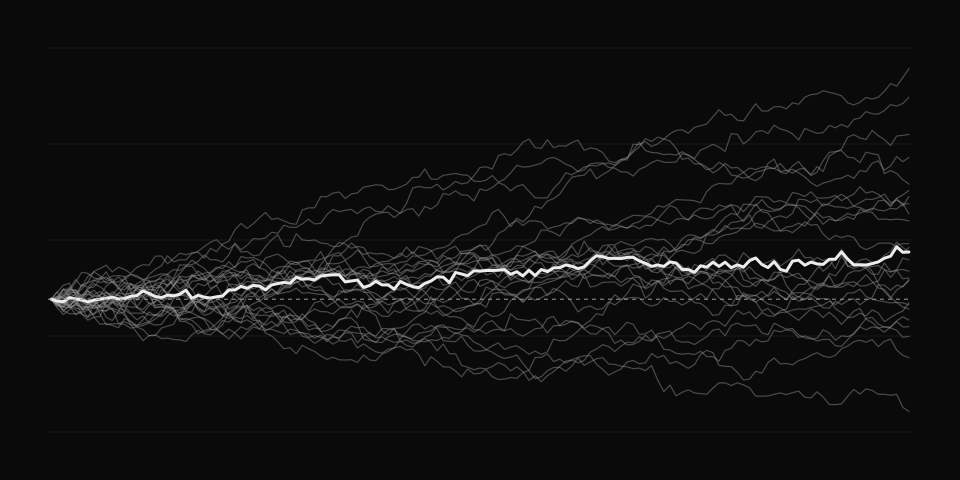
After 20 trades, a "55% strategy" could plausibly be a 35% strategy or a 75% one. Even after 100 trades, the range is ten points wide either way. This follows from the law of large numbers: averages settle down only as the sample grows.
There is no magic number, but as a rough guide:
Each breakdown, such as by setup, hour or weekday, divides your sample. A setup with 15 trades has 15 trades, even if your journal has 500.
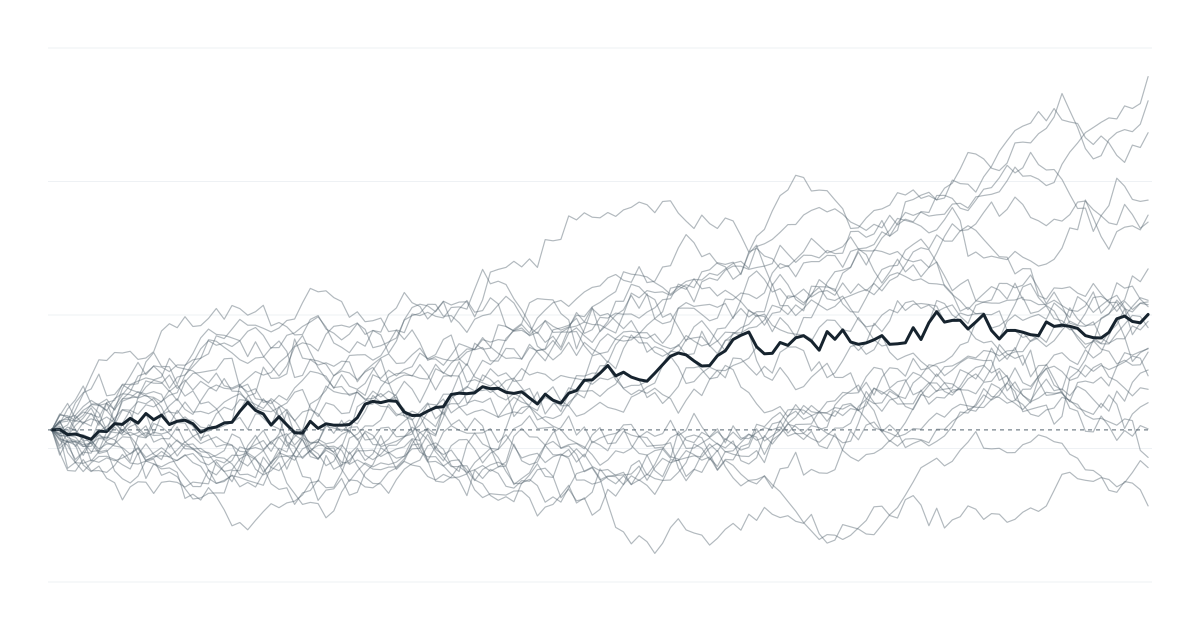
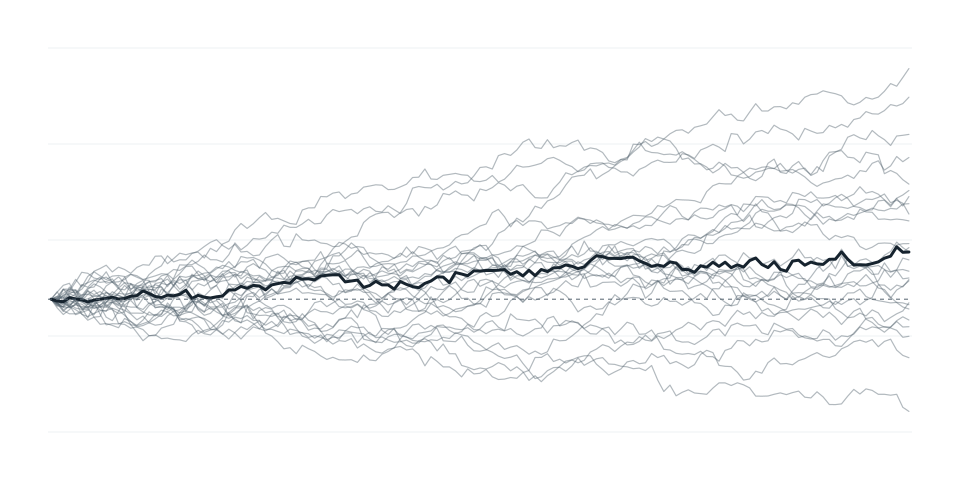
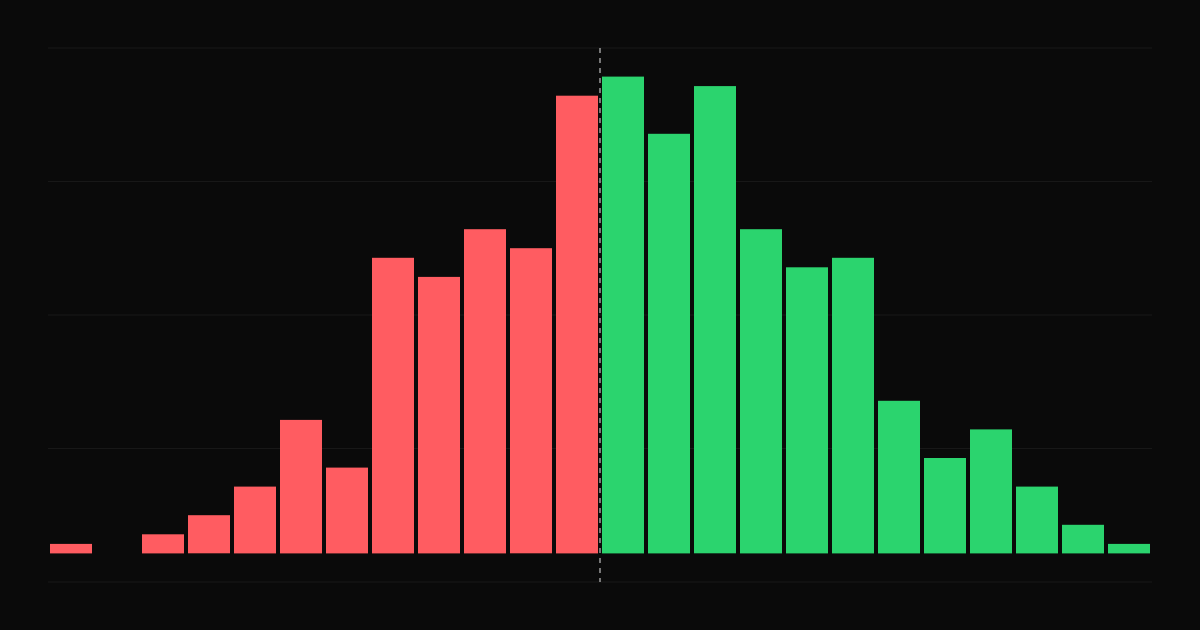
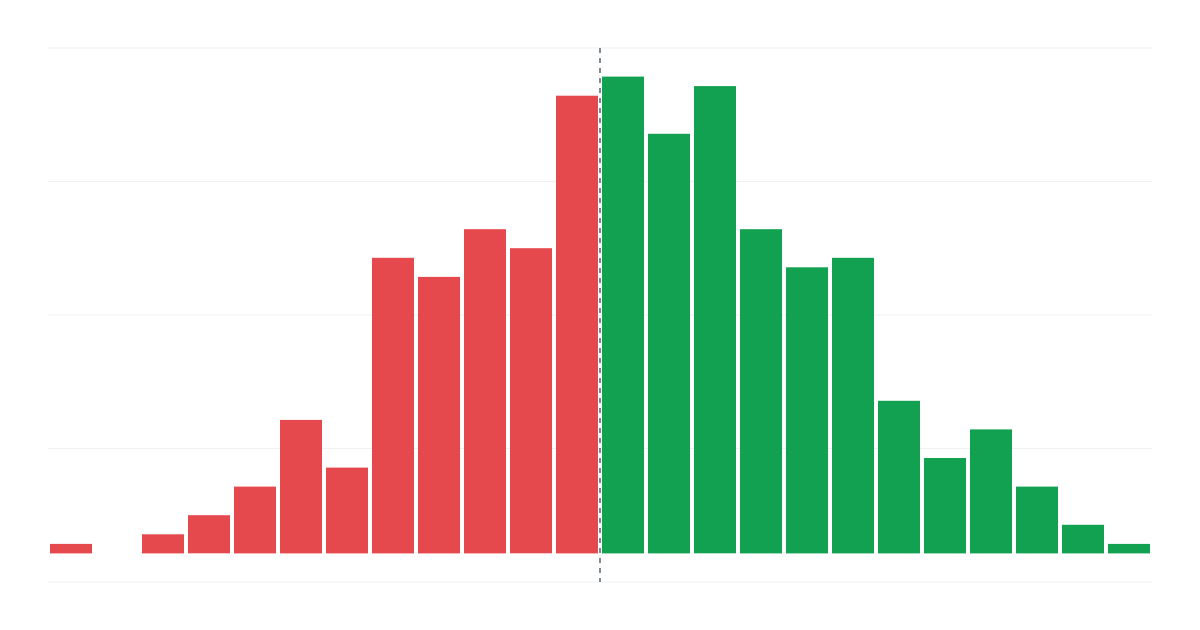
A practical way to see the range of outcomes is Monte Carlo simulation:
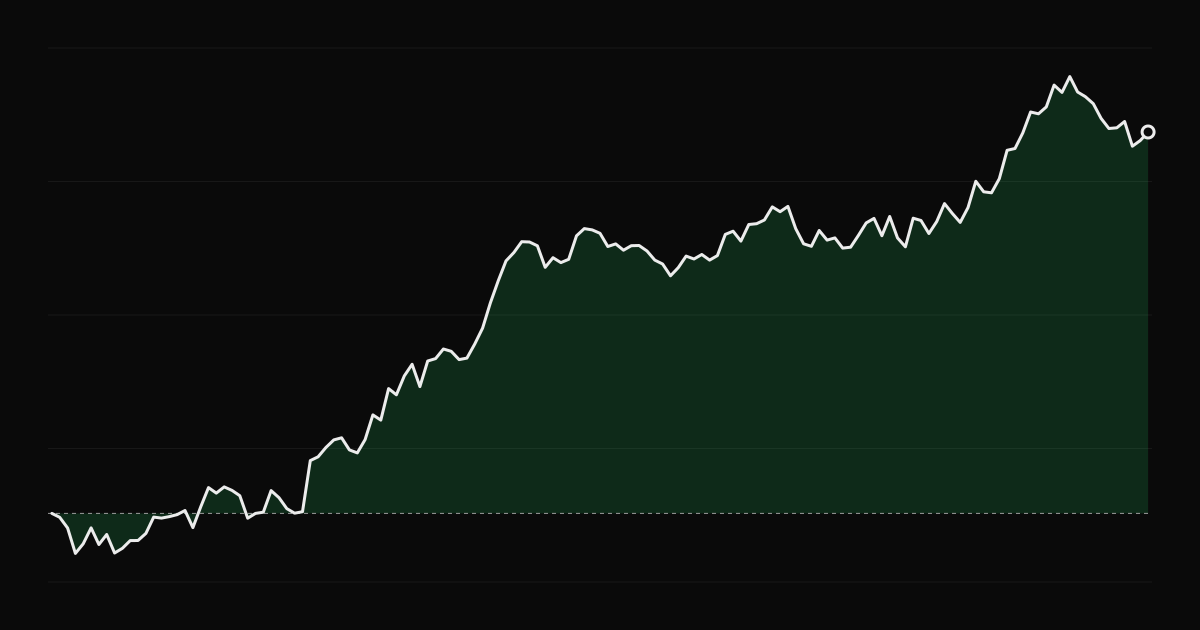
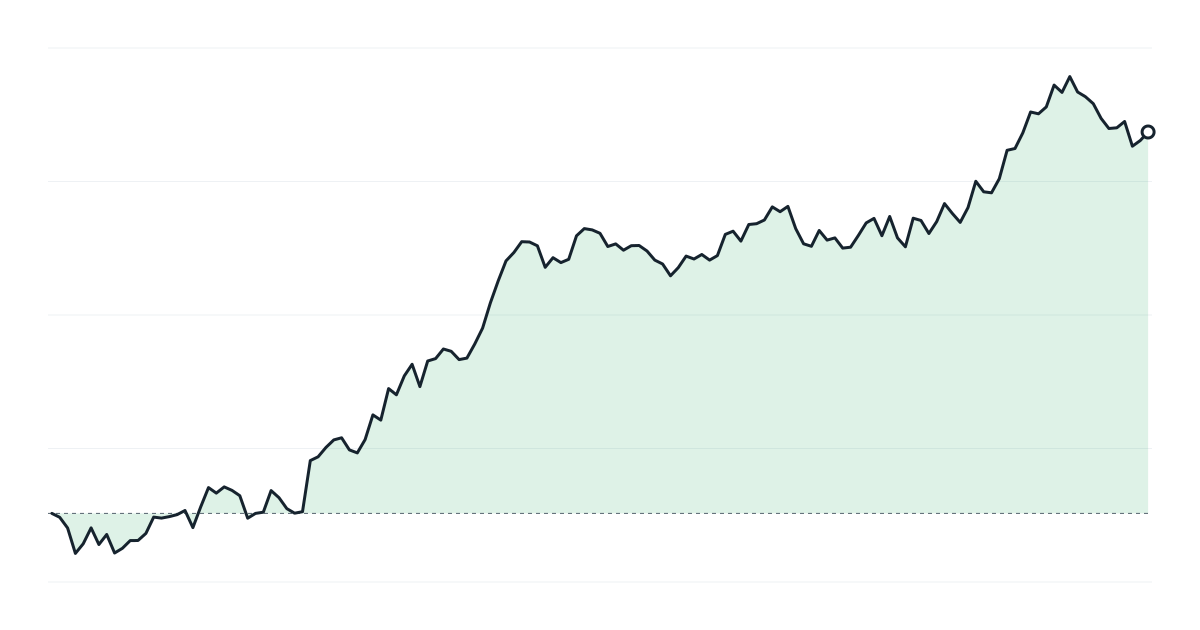
This shows how different your results could have been with the same edge, and how deep a drawdown you should be prepared for. See risk of ruin.
While your sample is small, focus on process: follow your plan, record everything and keep risk small. The statistics will become meaningful with time.
Every metric is shown with the number of trades it is based on, so you can tell a solid result from a thin one. Filter by setup in the reports and check the trade count before drawing conclusions. The free Kelly's Simulator shows how much random paths vary for a given edge.
How analyzing trade duration reveals hidden habits, why many traders hold losing trades longer than winners, and how to use holding time to improve exits.
How commissions, exchange fees, spreads and slippage add up, how to calculate their impact on your edge, and practical ways to keep trading costs under control.
Why a high win rate can still lose money, how profit factor captures the full picture, and how to read the two metrics together to judge your trading.