Options trading
Theta Decay: How Time Erodes Option Value
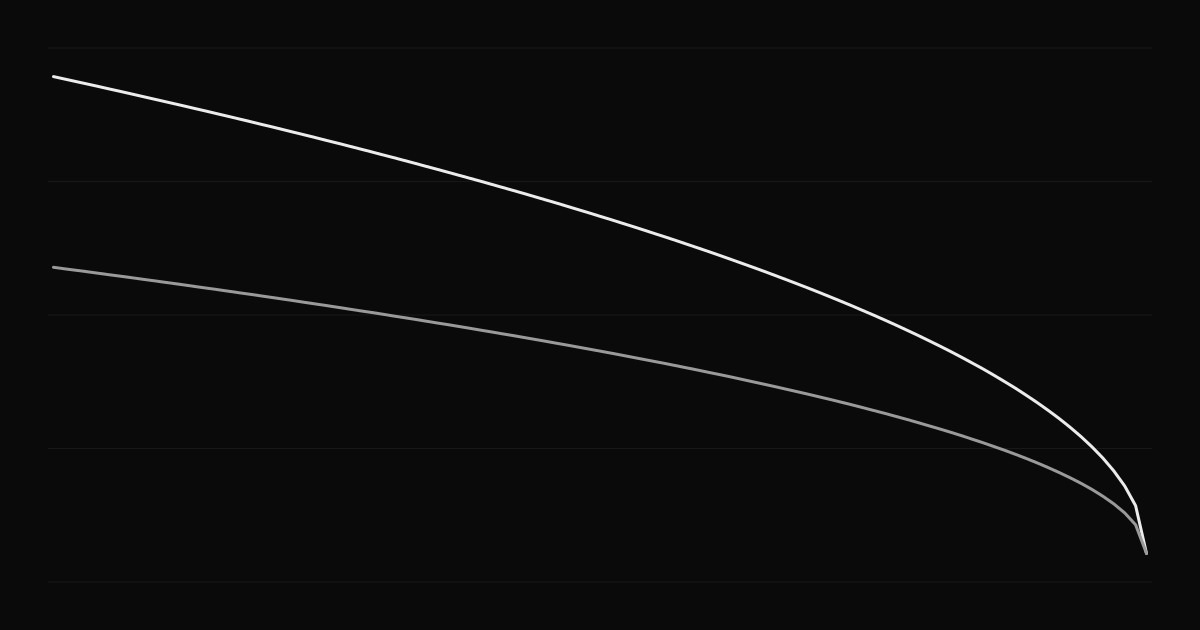
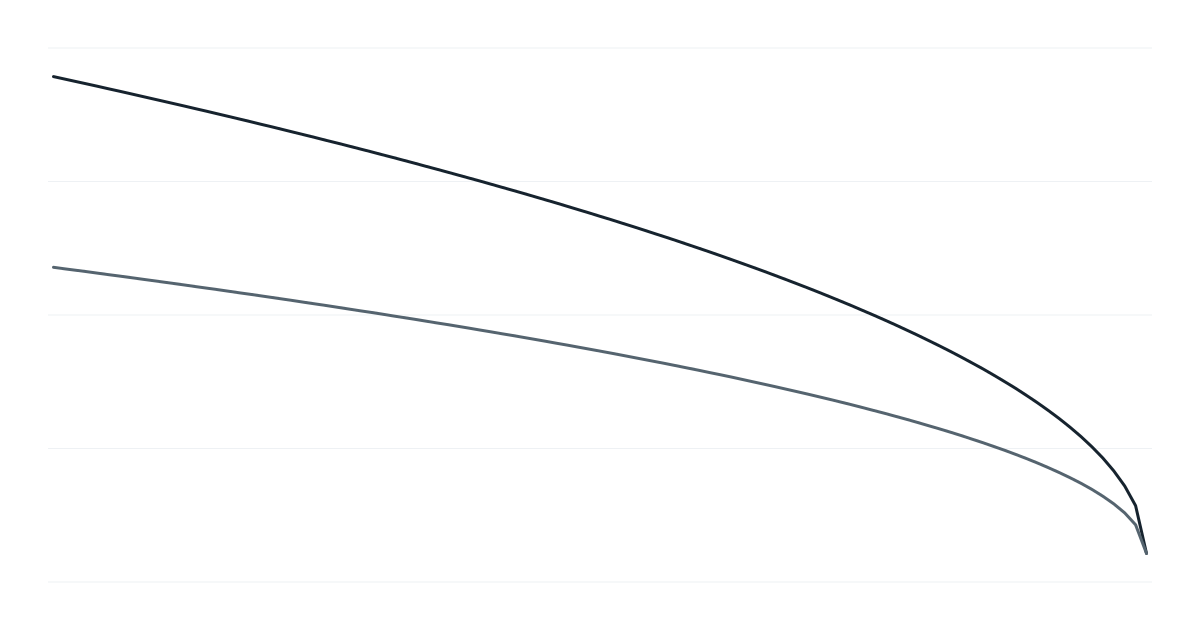
How theta and time decay work, why decay speeds up near expiration, how it affects long and short option positions, and how to use it in your strategy.
What implied volatility is, how it relates to expected moves, IV rank and percentile, volatility crush after events, and how IV affects option strategies.
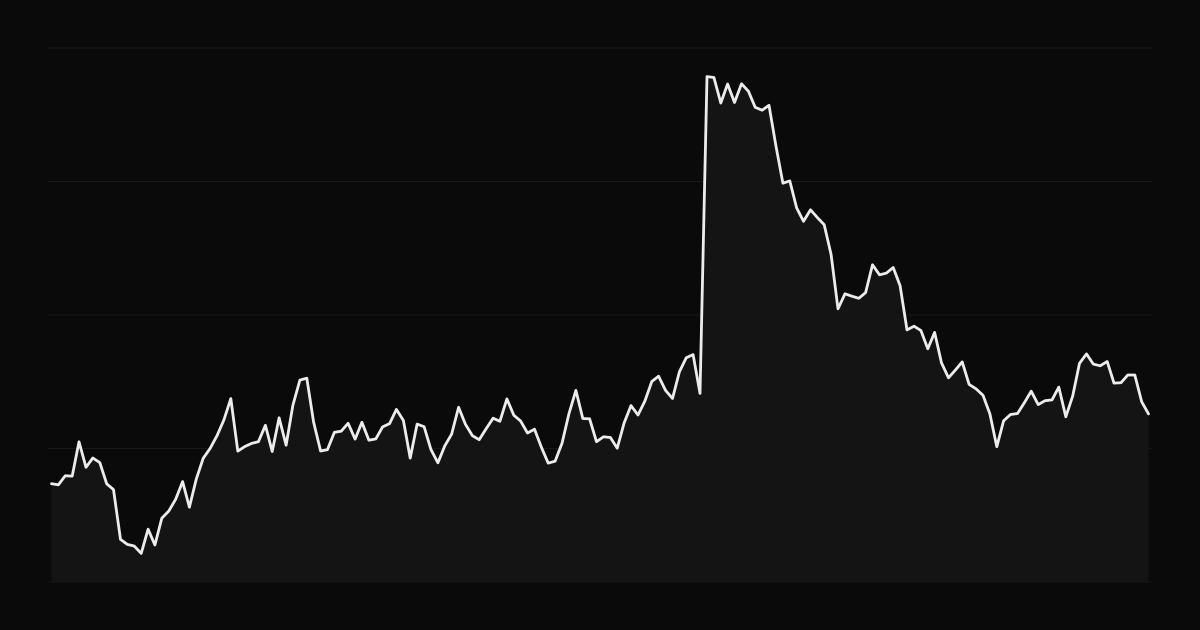
Implied volatility (IV) is the volatility the options market is pricing in. It is backed out from option prices using a model such as Black-Scholes. When traders expect bigger moves, they pay more for options, and implied volatility rises.
IV is quoted as an annualized standard deviation. A rough way to turn it into an expected move:
Expected move ≈ Price × IV × √(Days ÷ 365)
Example: a $100 stock with 30% IV, 30 days to expiration:
$100 × 0.30 × √(30 ÷ 365) ≈ $100 × 0.30 × 0.287 ≈ $8.60.
Under the model's assumptions, that is roughly a one-standard-deviation move: the price stays within about $91.40 to $108.60 around two thirds of the time. Real markets have fatter tails than the model assumes, so large moves happen more often than this suggests.
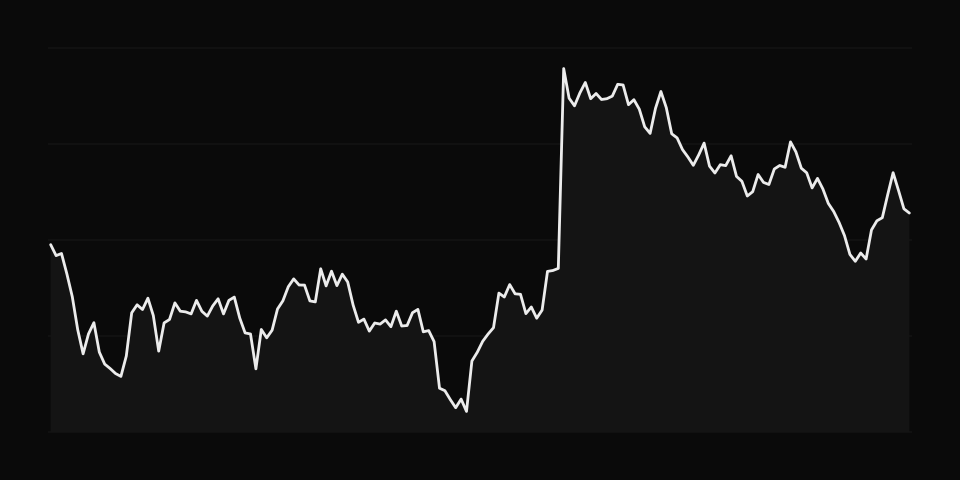
Options often price in somewhat more volatility than is later realized, which is part of why selling options can be profitable on average, and why it carries the risk of sudden large losses.
Is 30% IV high? It depends on the stock. Two common measures put IV in context:
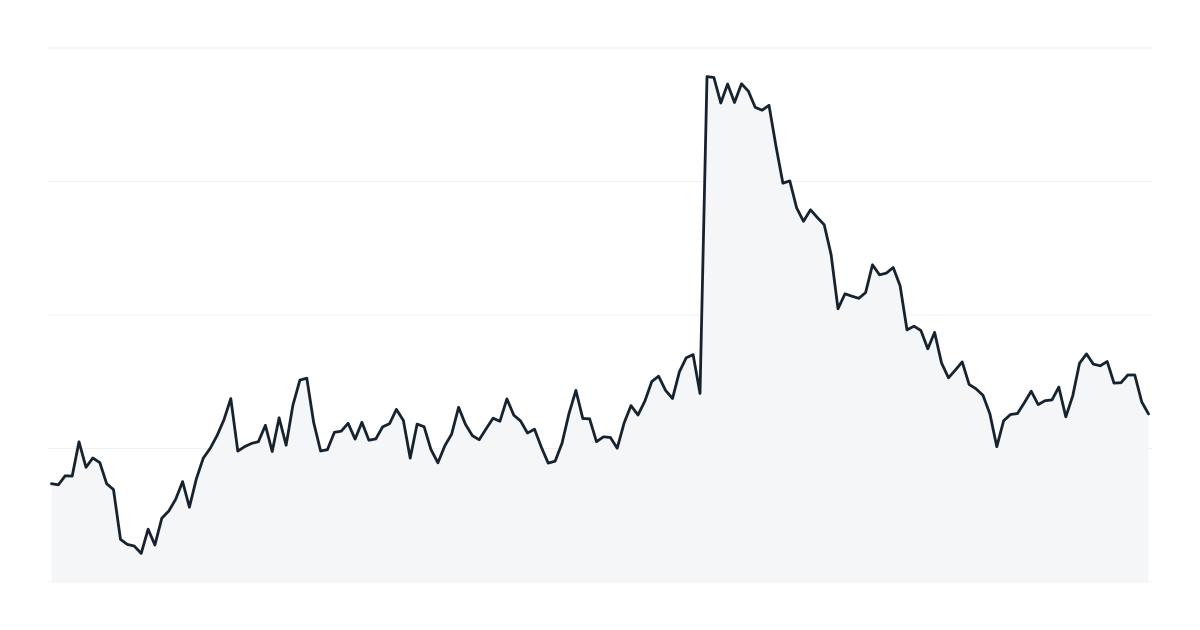
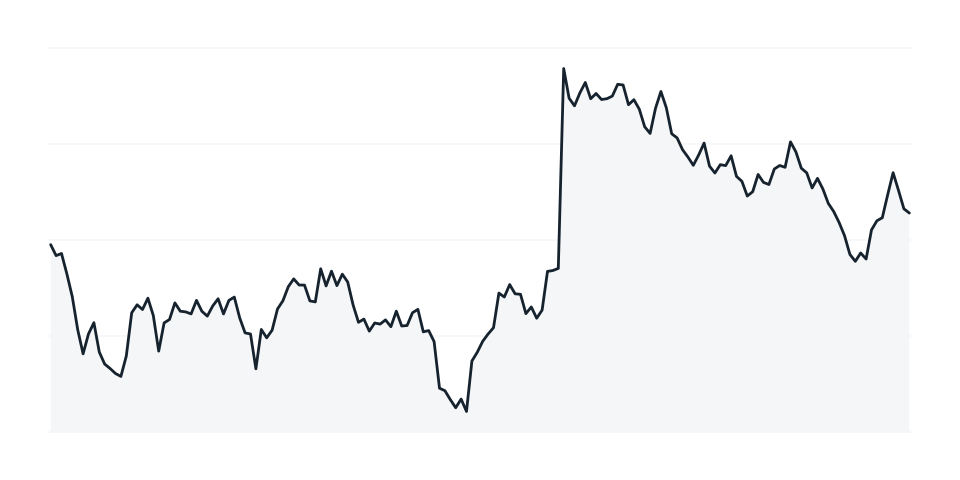
Before scheduled events such as earnings, IV often rises. After the event, the uncertainty is resolved and IV can fall sharply. Long options can lose value even when the stock moves in the right direction, if the move is smaller than priced in. See straddle vs strangle.
Many traders lean toward buying options when IV is low relative to its history and selling when it is high, but IV can stay high or keep rising, especially in falling markets.
The open positions page shows the live implied volatility and vega of each option, and the risk profile values later-dated legs with each leg's implied volatility. Related: the options greeks.
How theta and time decay work, why decay speeds up near expiration, how it affects long and short option positions, and how to use it in your strategy.
A guide to options risk profile (payoff) charts: the expiration line, the today line, break-evens, maximum profit and loss, and how to use the chart before and during a trade.
How long call butterflies and iron butterflies work, their maximum profit, maximum loss and break-evens, with worked examples and management tips.