Performance metrics
System Quality Number (SQN): Scoring Your Trading System
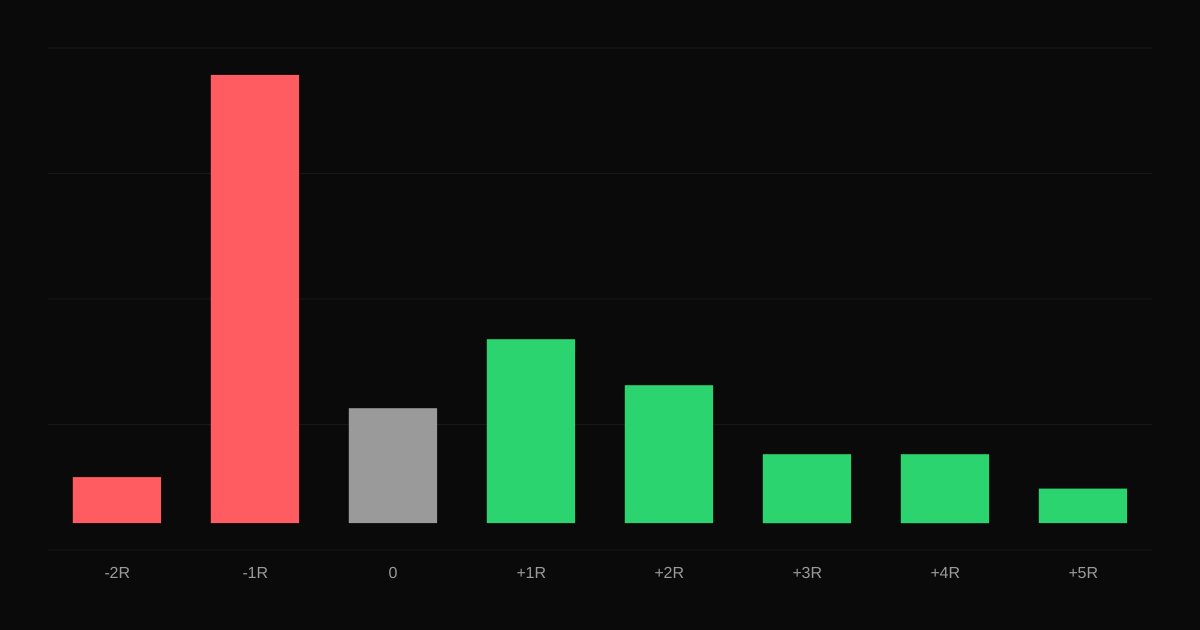
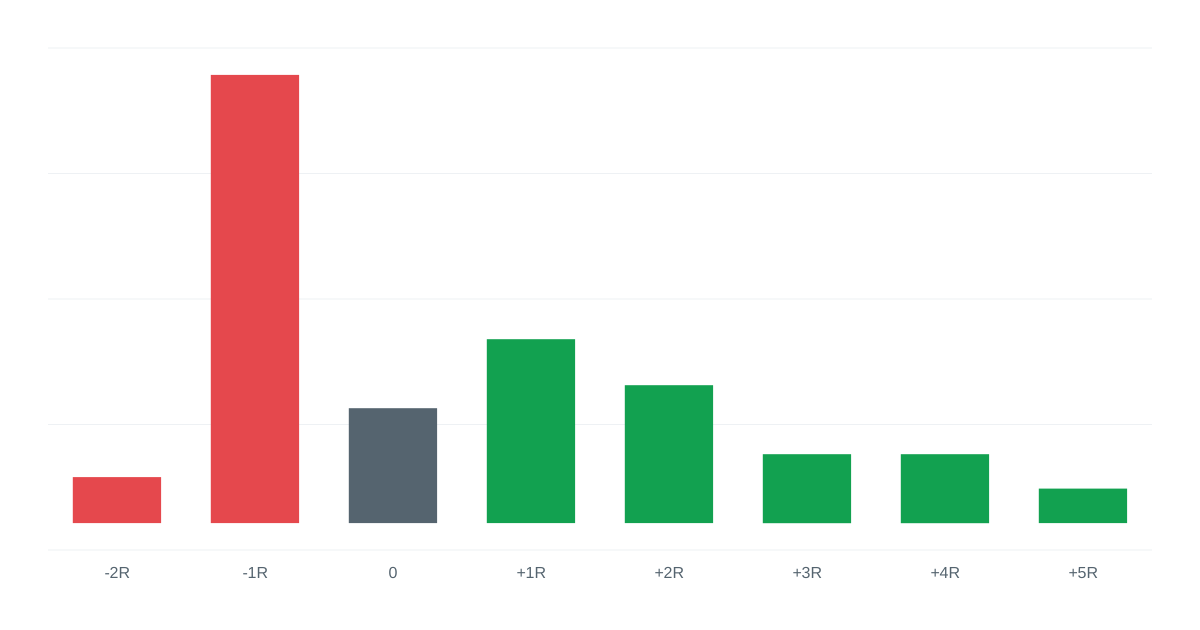
What the System Quality Number is, how to calculate it from your R-multiples, how to read the scores, and the pitfalls of using it on small samples.
How the Calmar ratio compares annual return with maximum drawdown, how to calculate it, what good values look like and when it is more useful than the Sharpe ratio.
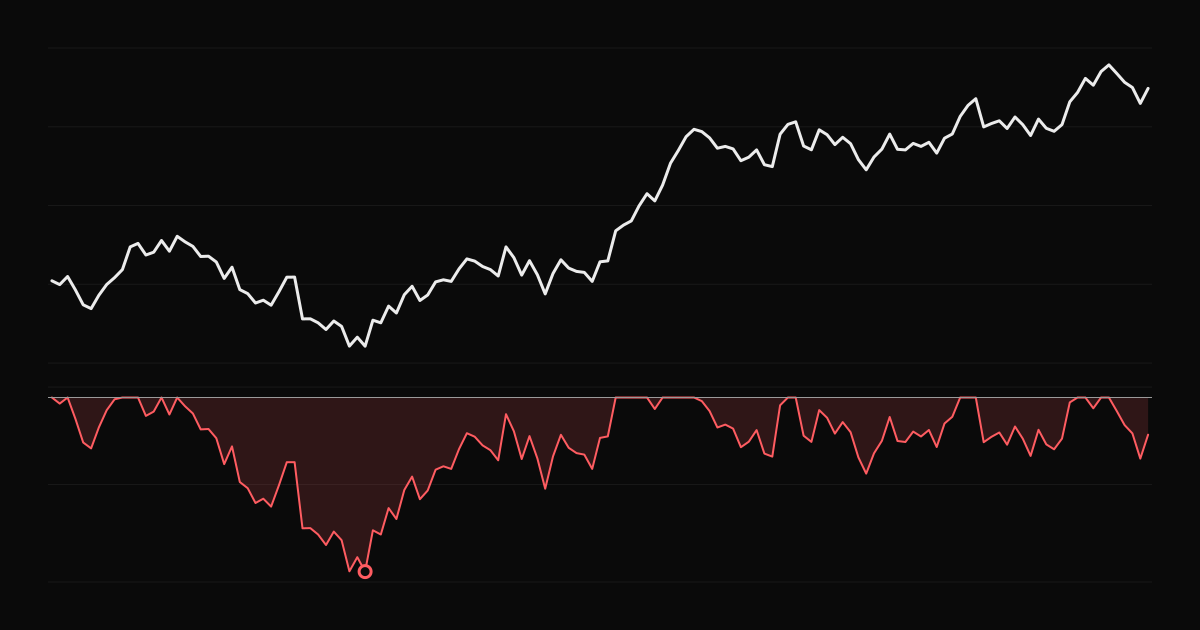
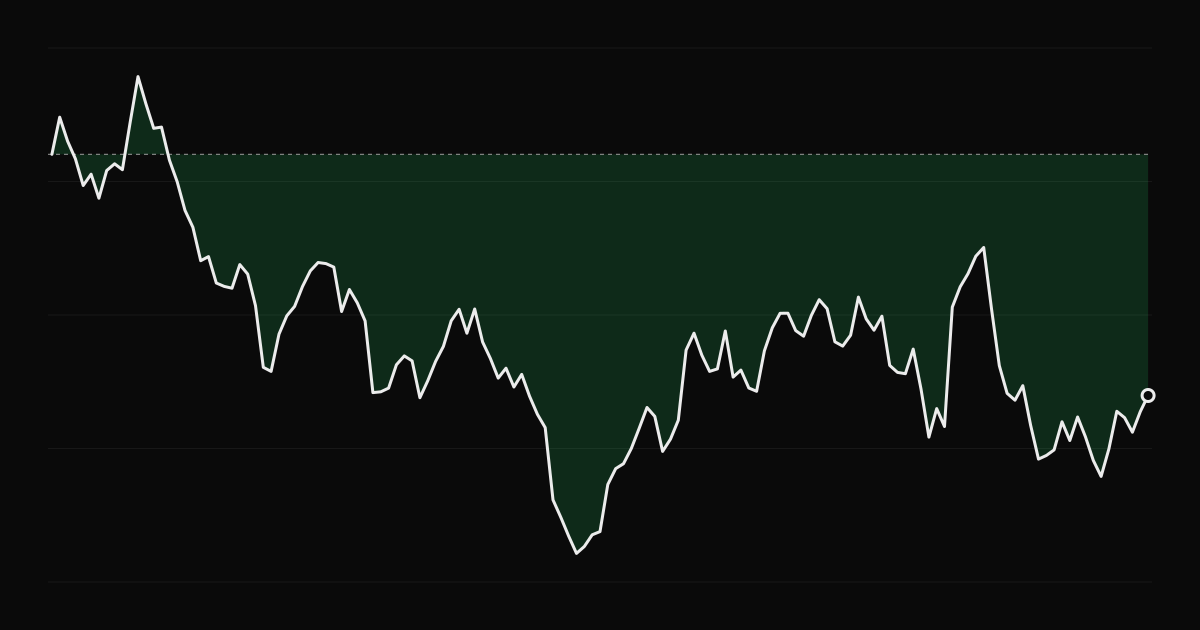
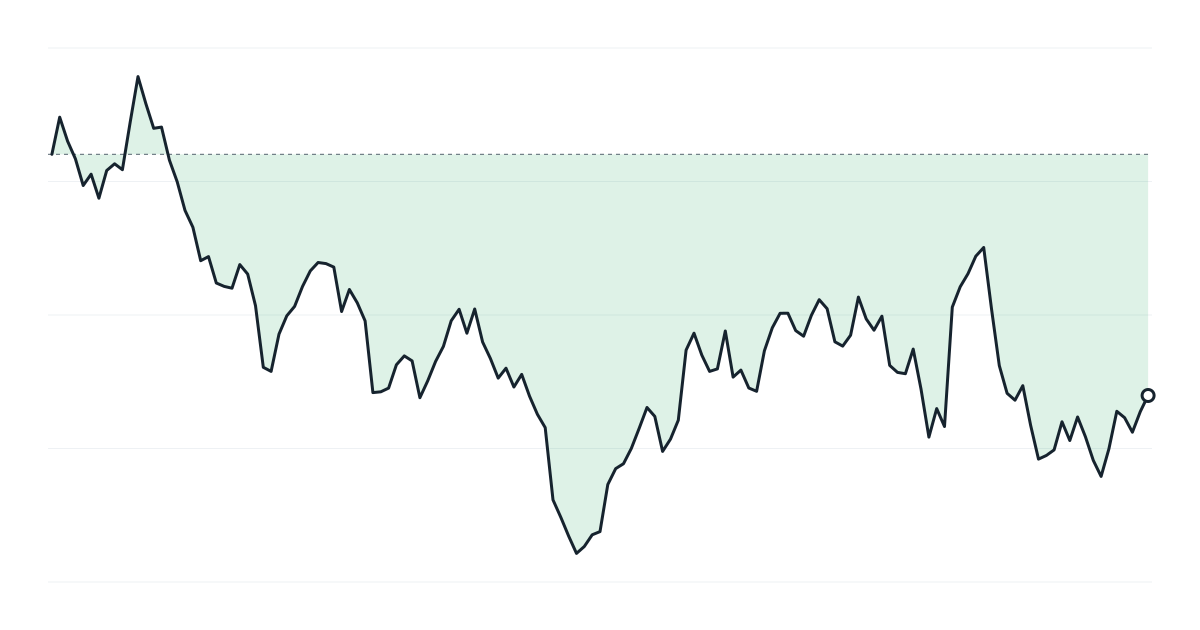
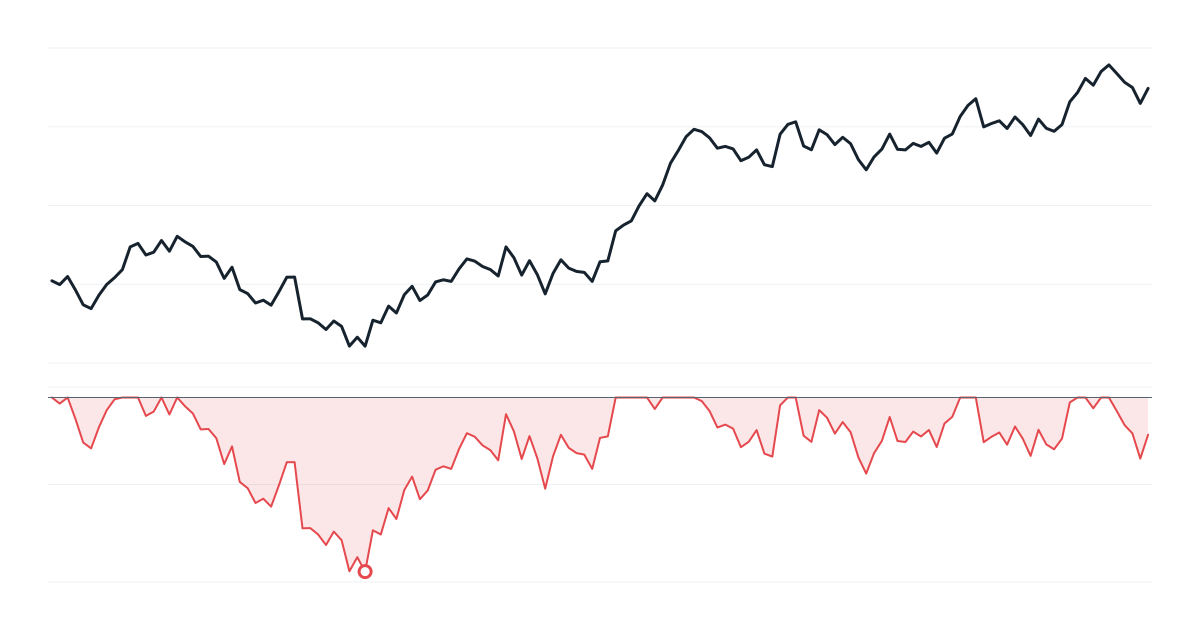
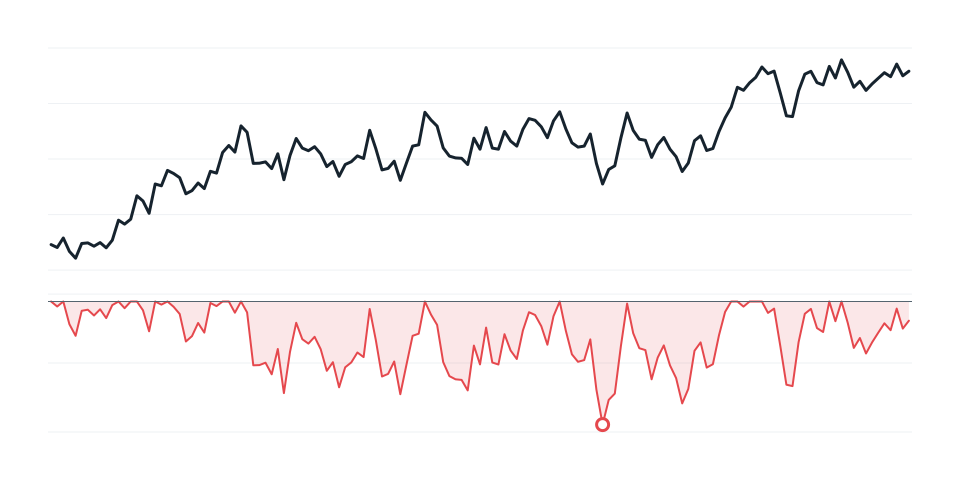
The Sharpe ratio measures return against day-to-day volatility. But what most traders actually fear is the big drawdown. The Calmar ratio, introduced by Terry Young in 1991, compares your return with the deepest drop your account has suffered.
Calmar ratio = Annualized return ÷ |Maximum drawdown|
Traditionally it is calculated over the last 36 months, but you can use any period, as long as you are consistent.
Example: your account returned 24% per year, and its maximum drawdown was −12%. Calmar = 24 ÷ 12 = 2.0.
Another account returned 40%, but had a −40% drawdown. Calmar = 1.0. Despite the higher return, it delivered less return per unit of drawdown.
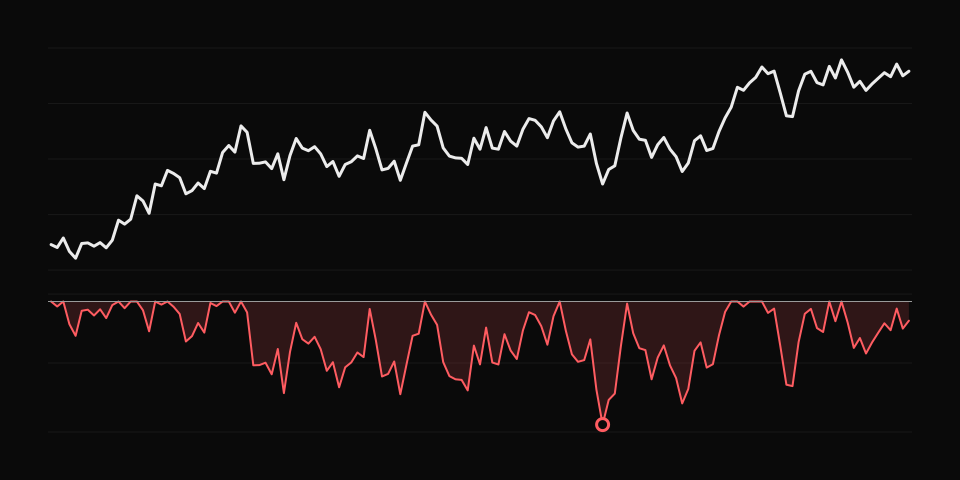
As a rough guide:
Pair Calmar with the Sharpe and Sortino ratios and with drawdown duration. Together they describe both the typical and the worst-case experience of a strategy.
The Calmar ratio, maximum drawdown and annualized return are on the statistics page, with a drawdown chart on the dashboard and reports.
What the System Quality Number is, how to calculate it from your R-multiples, how to read the scores, and the pitfalls of using it on small samples.
Your equity curve tells the story of your trading. Learn to read slope, smoothness, drawdowns, step changes and flat periods, and what each one suggests you should do.
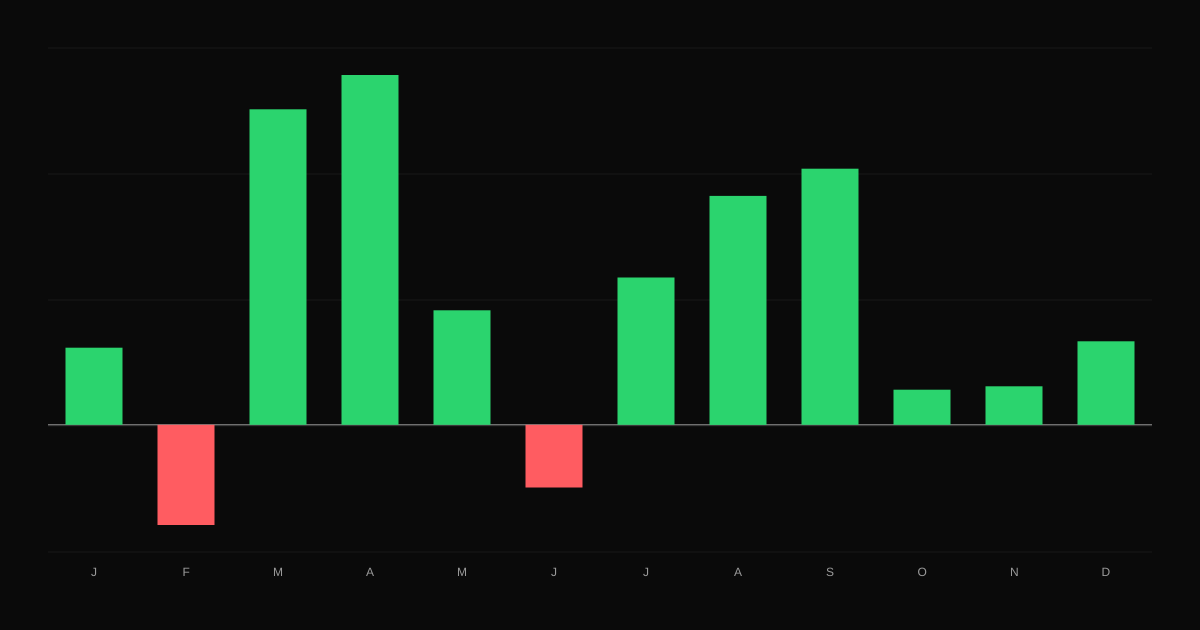
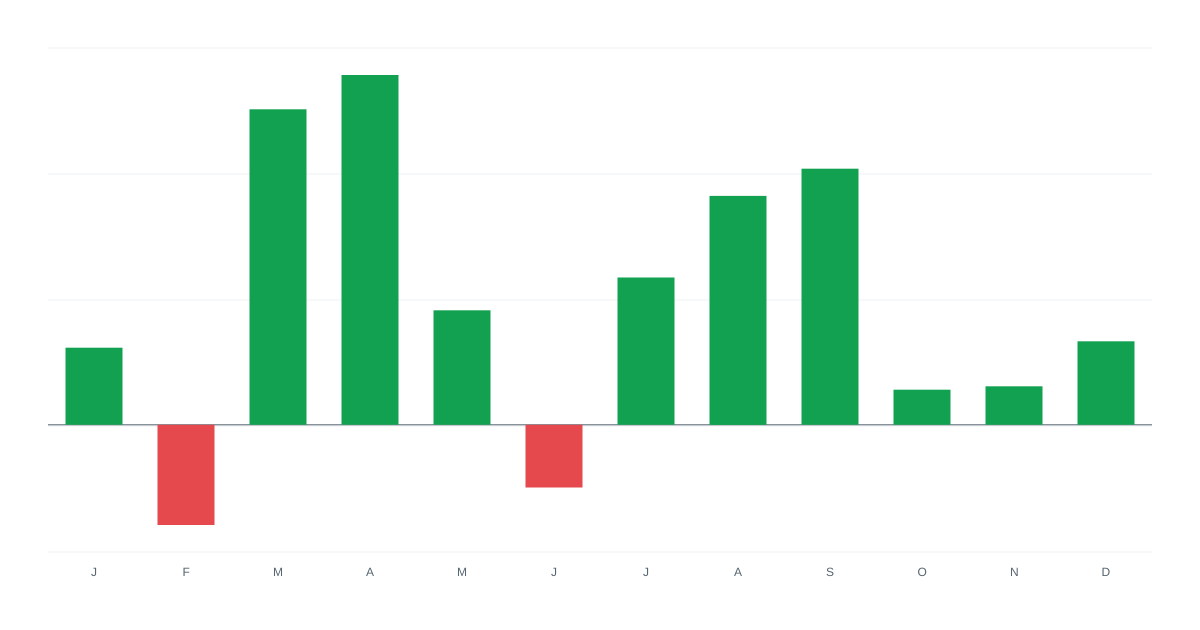
How to measure whether your trading is consistent, using winning days and weeks, the share of profit from your best days, monthly results and streaks.