Options trading
Butterfly Spreads and the Iron Butterfly: Targeting a Price
How long call butterflies and iron butterflies work, their maximum profit, maximum loss and break-evens, with worked examples and management tips.
A guide to options risk profile (payoff) charts: the expiration line, the today line, break-evens, maximum profit and loss, and how to use the chart before and during a trade.
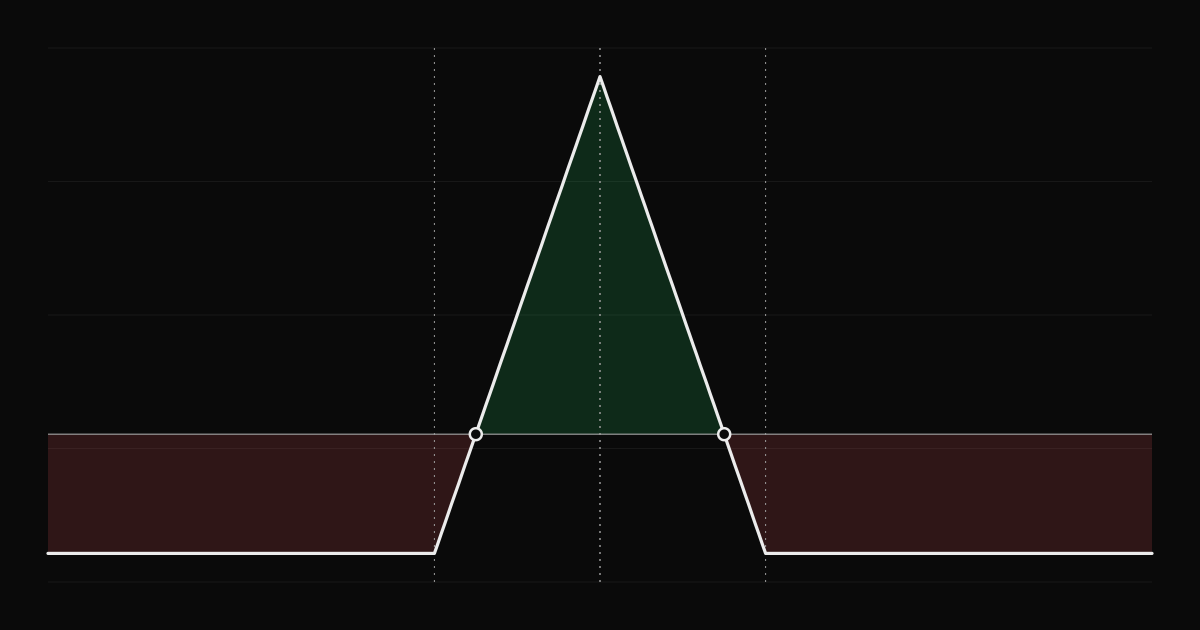
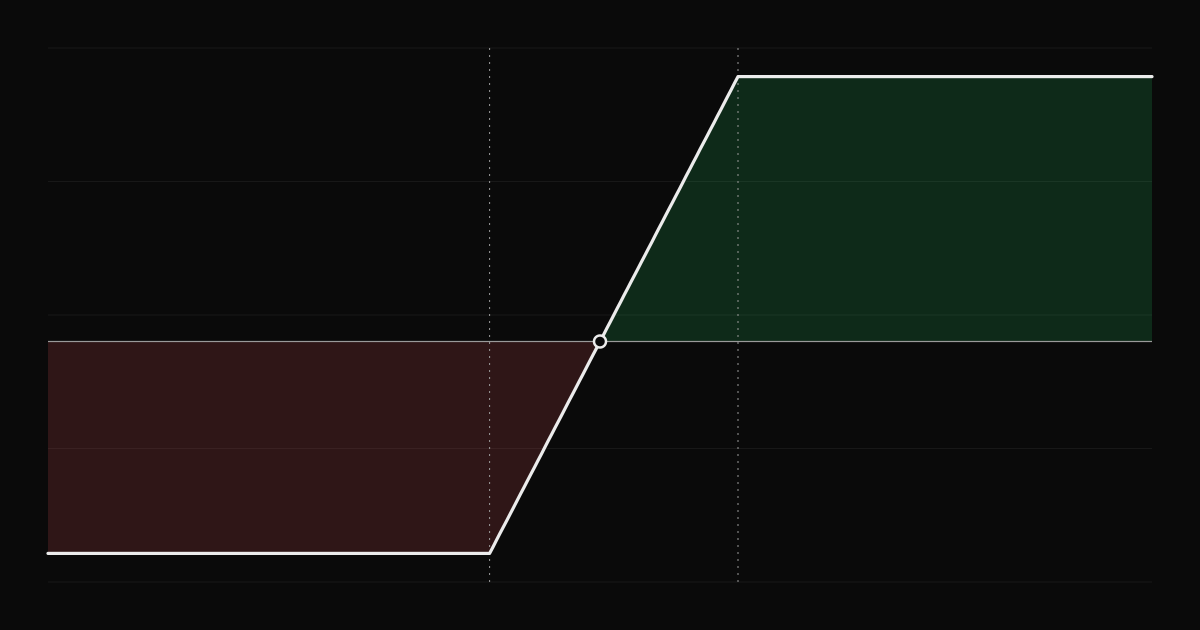
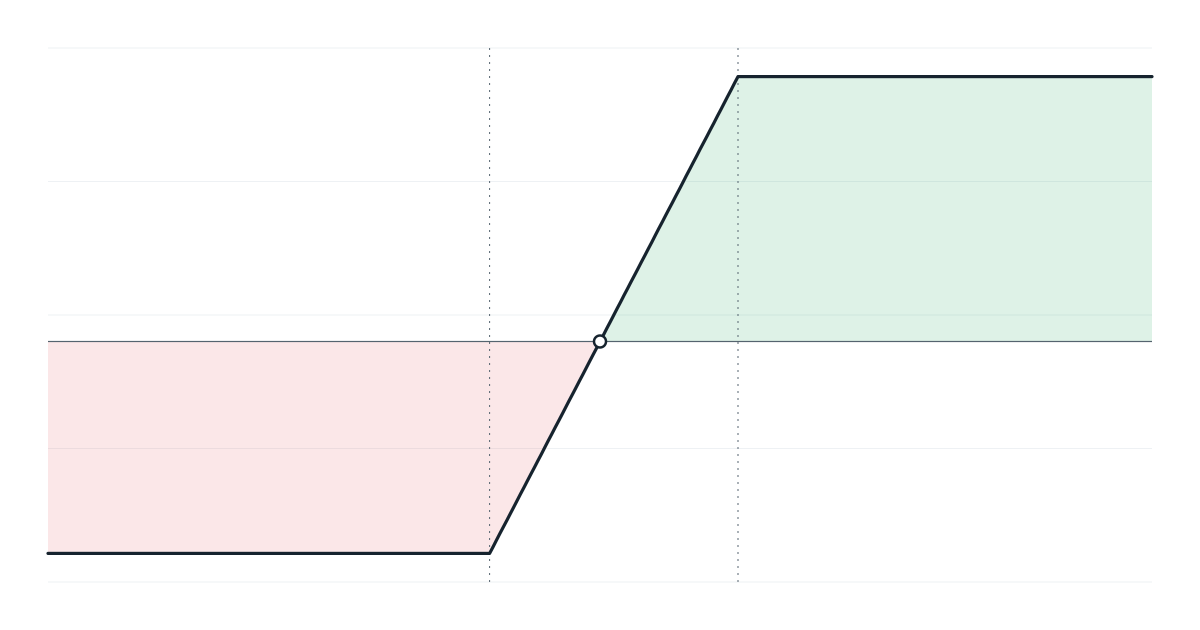
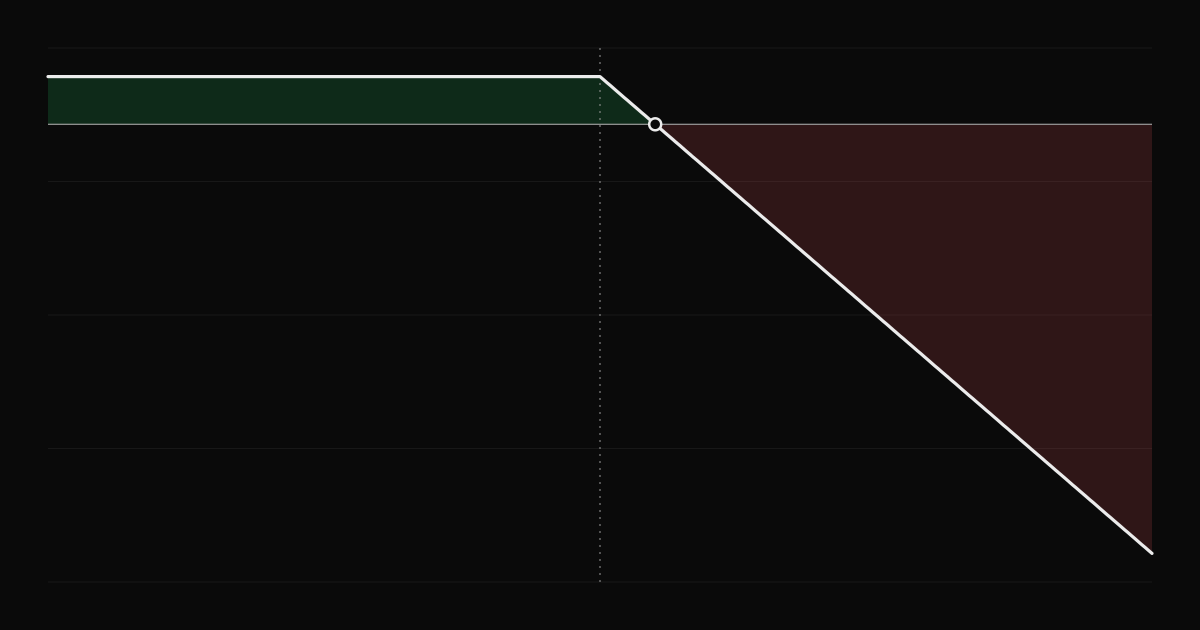
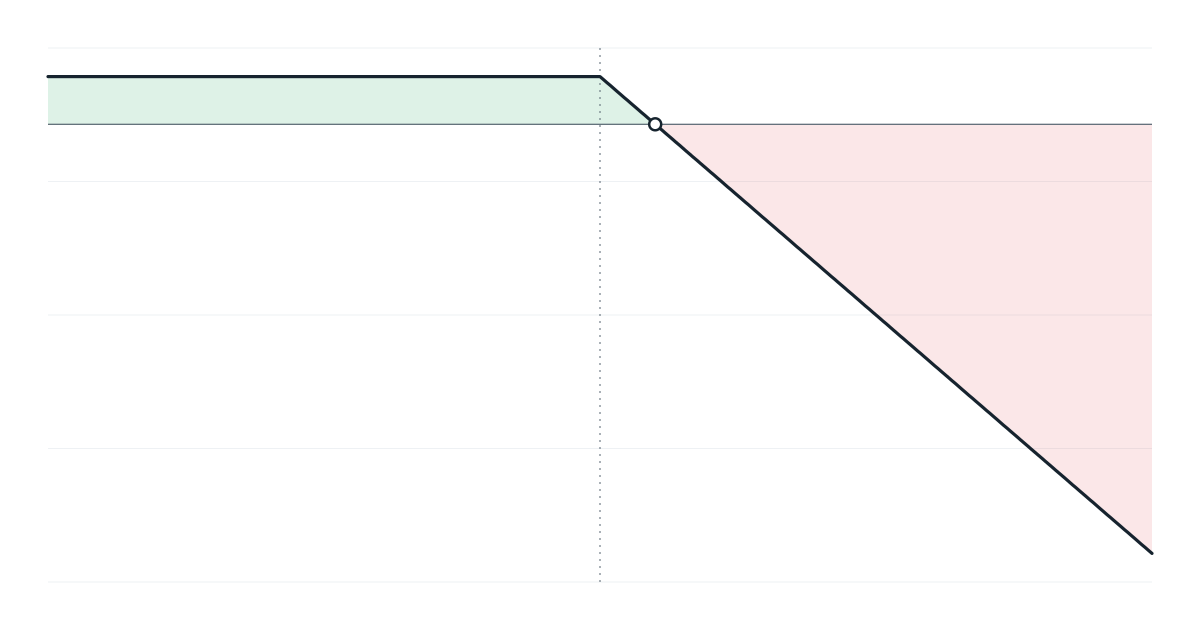
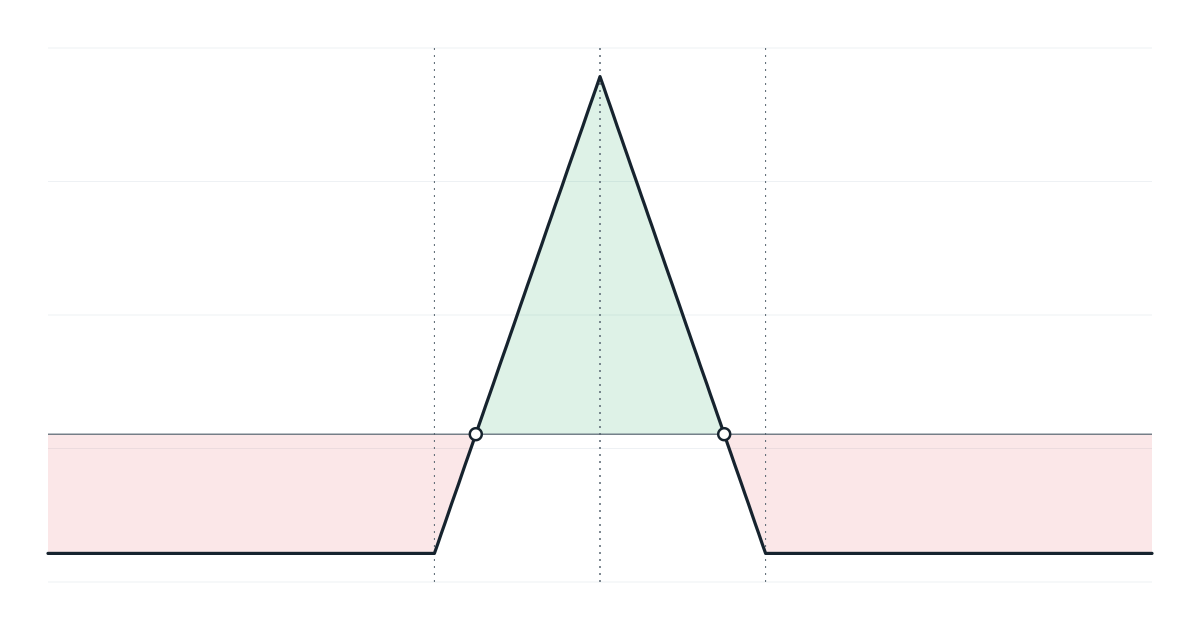
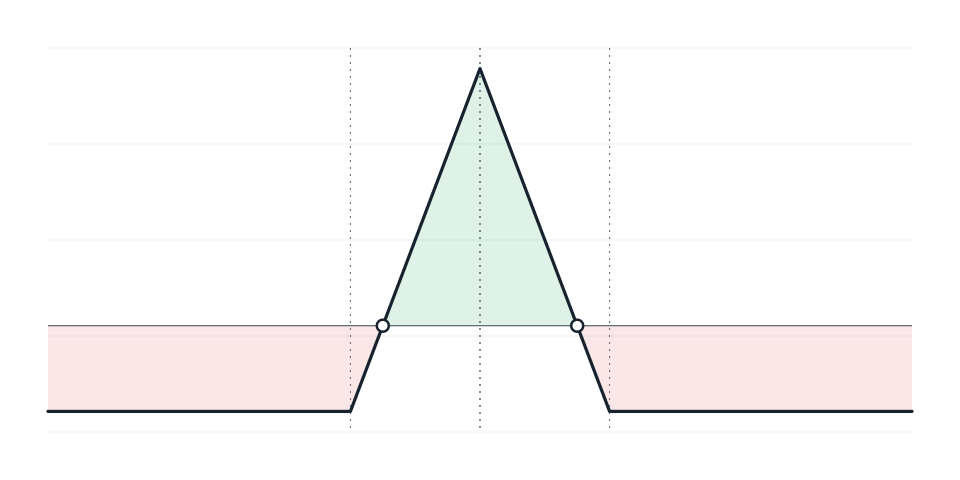
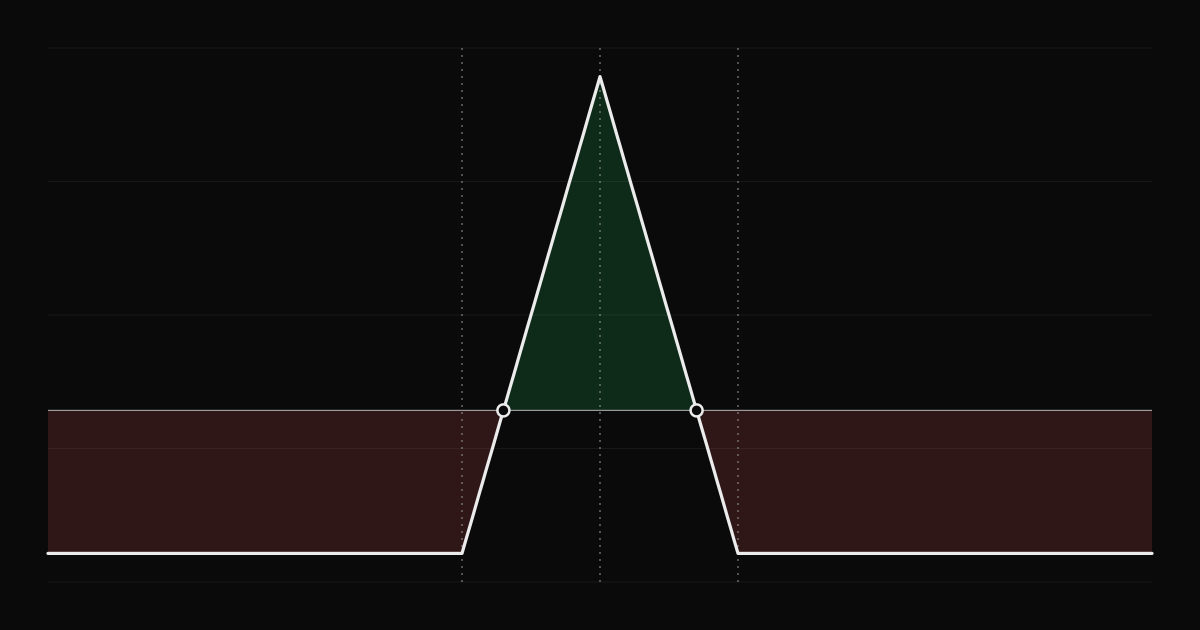
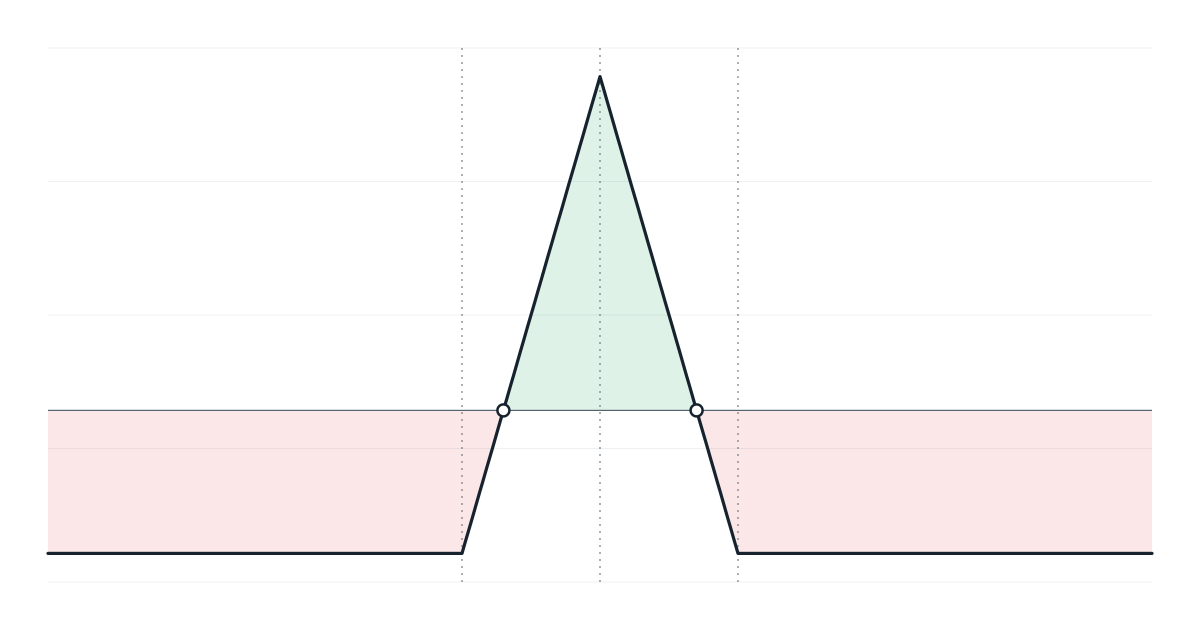
A risk profile chart shows how much an options position makes or loses across a range of underlying prices. It is the single best tool for understanding a multi-leg trade, because it shows the whole risk at a glance, including the parts that a list of legs hides.
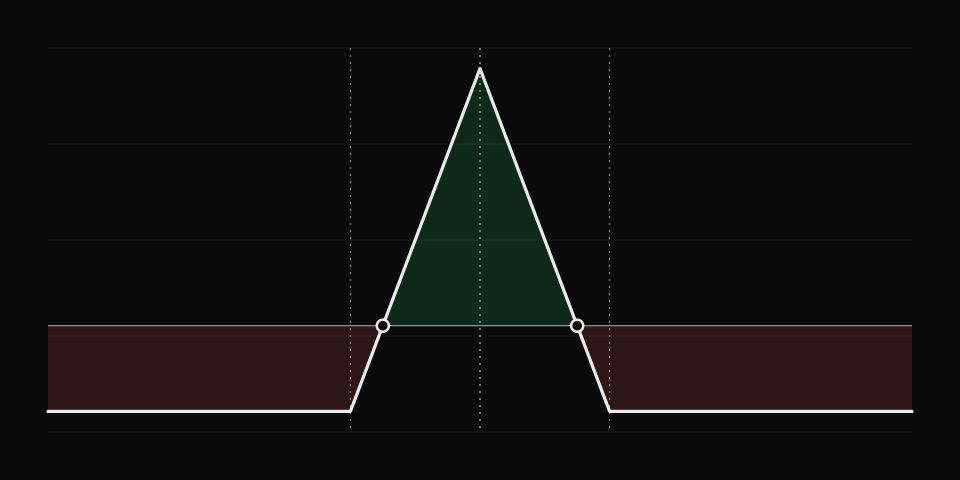
The solid line shows P&L at expiration, when each option is worth only its intrinsic value. It is made of straight segments with corners at the strikes. It tells you:
Many charts also show a curved line for P&L today, based on a pricing model with current implied volatility. The gap between today's line and the expiration line is mostly time value. As expiration approaches, the today line moves toward the expiration line. See theta decay.
Check the chart as the price moves. A trade that looked safe at entry may now sit near a short strike, where gamma is highest. The chart shows how much is at stake at each price, which makes decisions about adjusting or closing much clearer.
Right-click any options trade and choose Risk profile to see the expiration line, the today line when live prices are available, break-evens, maximum profit and loss and a table of legs. Hover to read P&L at any price, and zoom or drag the chart to see a wider or narrower range. See the risk profile docs.
How long call butterflies and iron butterflies work, their maximum profit, maximum loss and break-evens, with worked examples and management tips.
How a protective put limits downside on stock you own, how a collar pays for that protection by selling a call, with payoffs, examples and trade-offs.
What happens to options at expiration, how exercise and assignment work, early assignment risk, pin risk, and how to avoid surprises in your account.