Strategy and analysis
Gap Trading: Gap and Go vs Gap Fade Strategies
Why stocks gap at the open, the difference between gap-and-go and gap-fade setups, what affects which one works, and how to manage the risk of trading gaps.
How the relative strength index is calculated, what overbought and oversold really mean, divergences, and how to use RSI as a filter rather than a signal on its own.
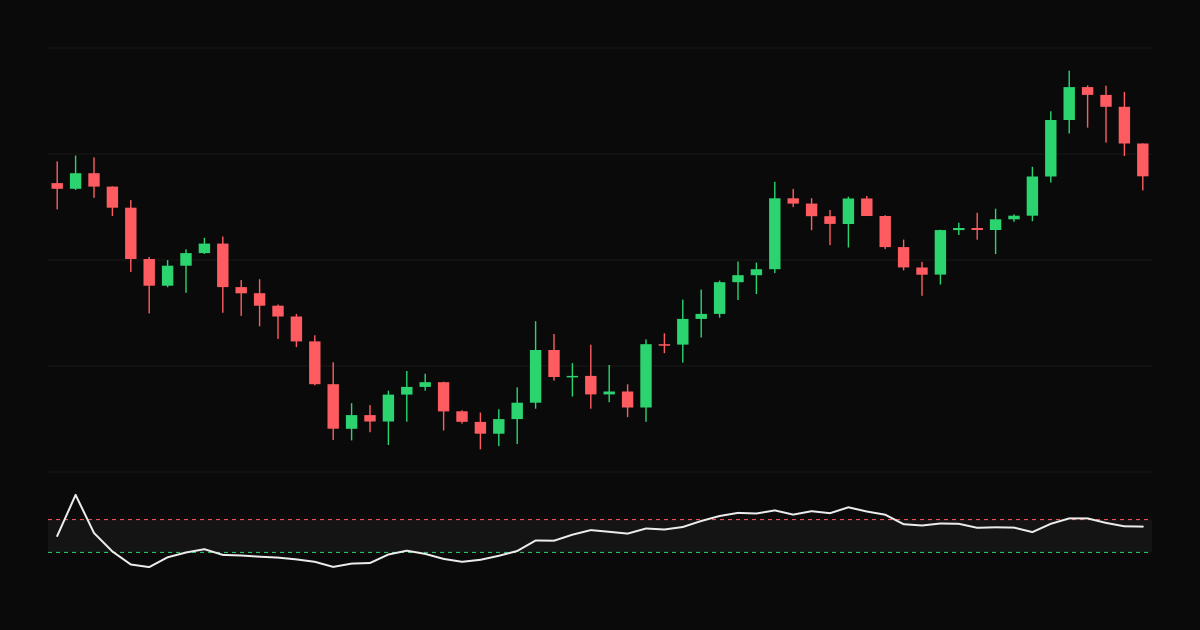
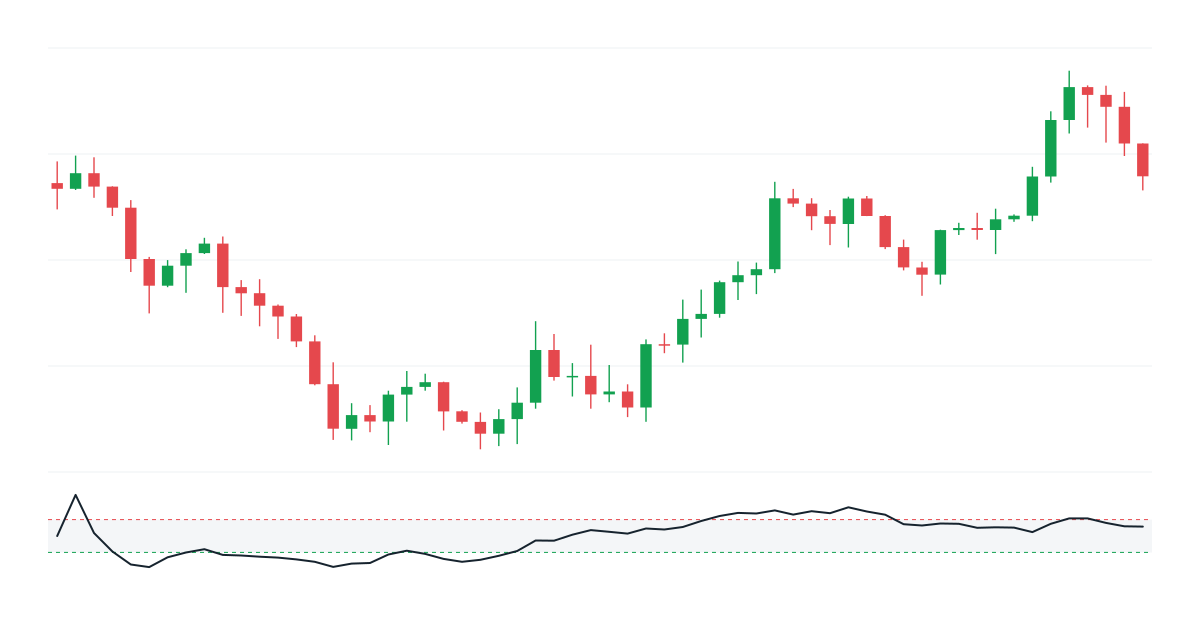
The relative strength index (RSI), developed by J. Welles Wilder, is a momentum oscillator that moves between 0 and 100. It compares the size of recent gains with recent losses, most commonly over 14 periods.
RSI = 100 − 100 ÷ (1 + RS)
where RS is the average gain divided by the average loss over the period. Wilder used a smoothed average. When gains dominate, RSI rises toward 100; when losses dominate, it falls toward 0.
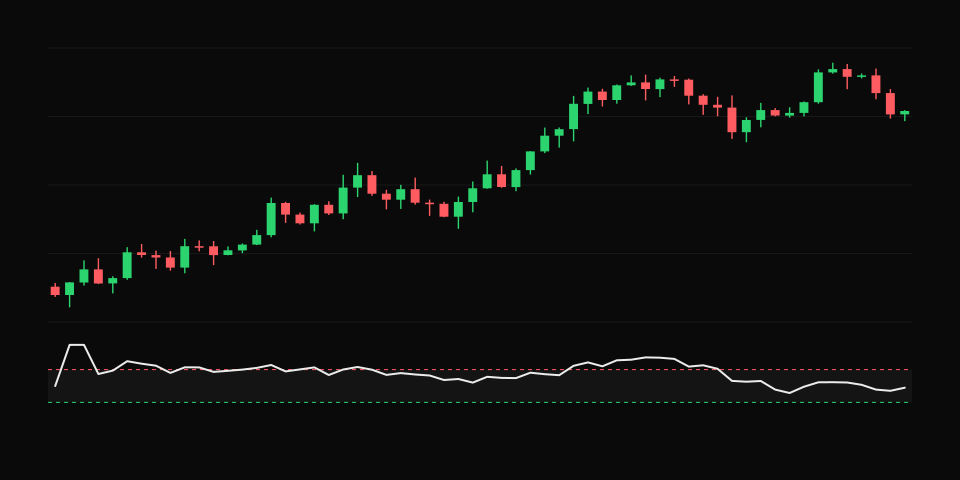
The traditional thresholds are:
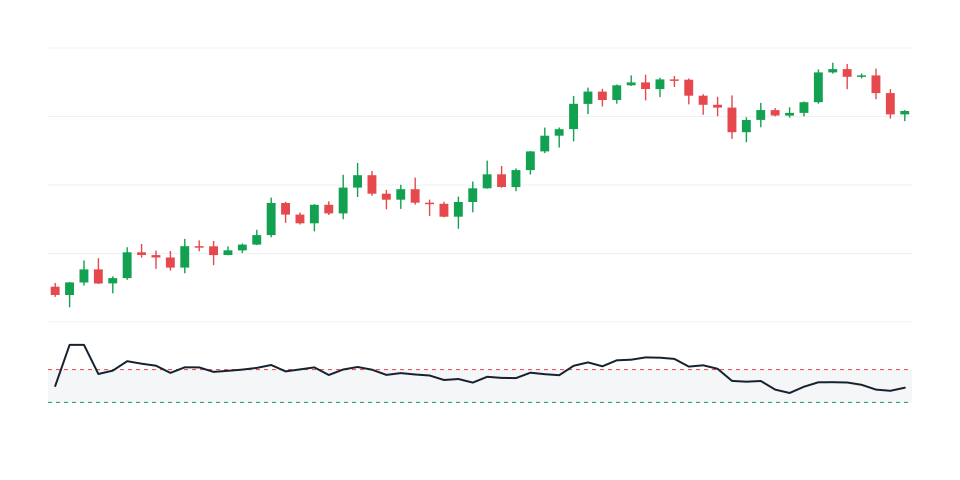
The names are misleading. In a strong uptrend, RSI can stay above 70 for a long time while price keeps rising. Selling every time RSI crosses 70 in a strong trend is a reliable way to lose money. Overbought means momentum is strong, not that price must fall.
Some traders treat an RSI that holds above about 40 to 50 on pullbacks as a sign of an uptrend, and one that stays below 50 to 60 on bounces as a downtrend.
In an uptrend, a dip in RSI toward 40 or lower can mark a pullback worth watching. See pullback trading.
When price makes a new high but RSI makes a lower high, momentum is weakening. Divergence is not a timing signal. It can persist through several more highs. Use it as a warning, then wait for price confirmation, such as a break of structure.
Combine RSI with your main setup: for example, take breakout trades only when RSI is not already extremely stretched, or take mean-reversion trades only when RSI is extreme.
A 14-period RSI is standard. Shorter periods make it more sensitive and noisier. Longer periods make it smoother. As with any indicator, avoid tuning settings to fit past data. See backtesting vs journaling.
Tag trades with the RSI condition at entry, such as "RSI above 70" or "RSI divergence", and compare their expectancy with your other trades. In TradeThink, tags and filters in the reports make this comparison quick.
Why stocks gap at the open, the difference between gap-and-go and gap-fade setups, what affects which one works, and how to manage the risk of trading gaps.
How to trade pullbacks within a trend, how to tell a healthy pullback from a reversal, entry triggers, stop placement and how to measure your pullback setups.
The core principles of trend following, typical entry and exit rules, the low win rate and long drawdowns to expect, and how a journal helps you stay disciplined.