Strategy and analysis
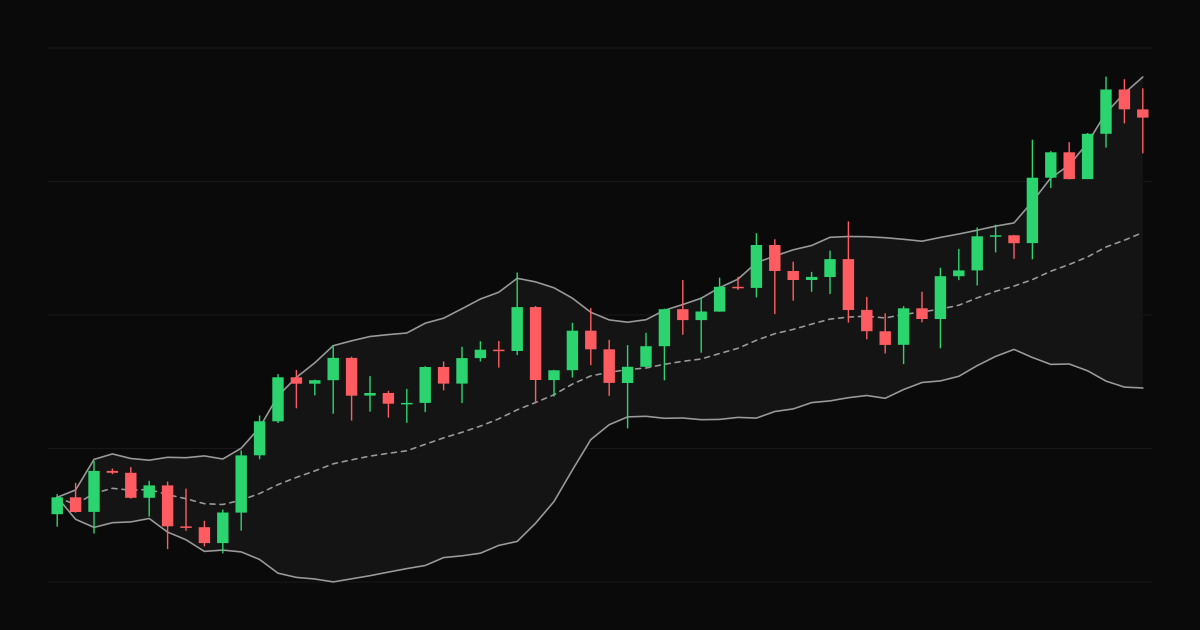
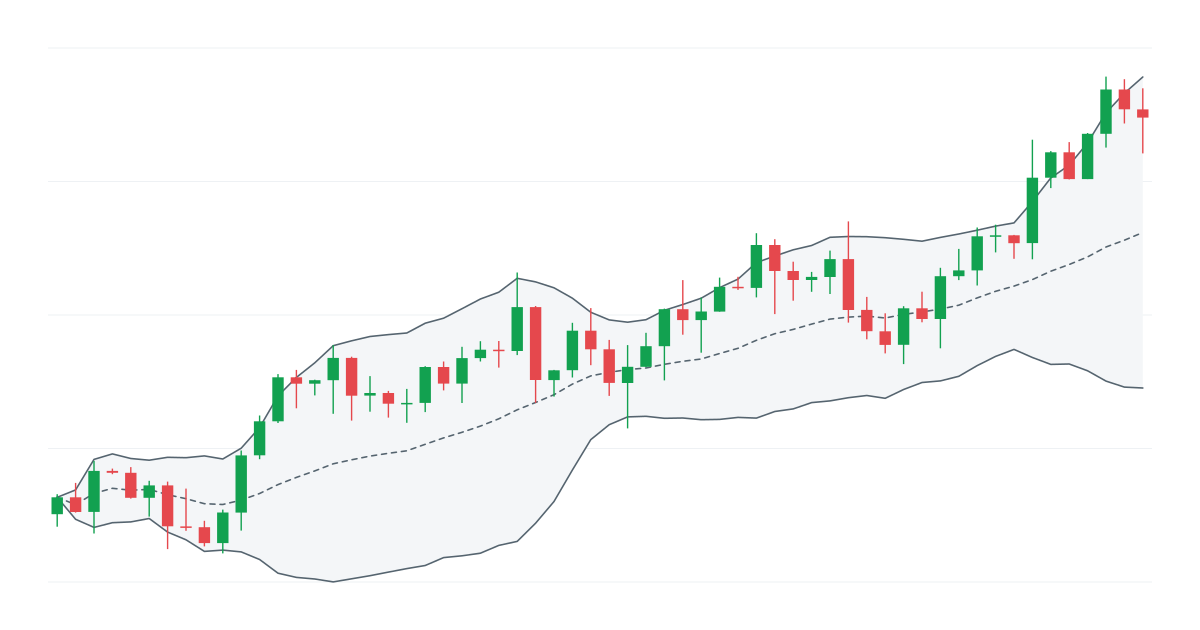
Bollinger Bands: Volatility, Squeezes and Mean Reversion
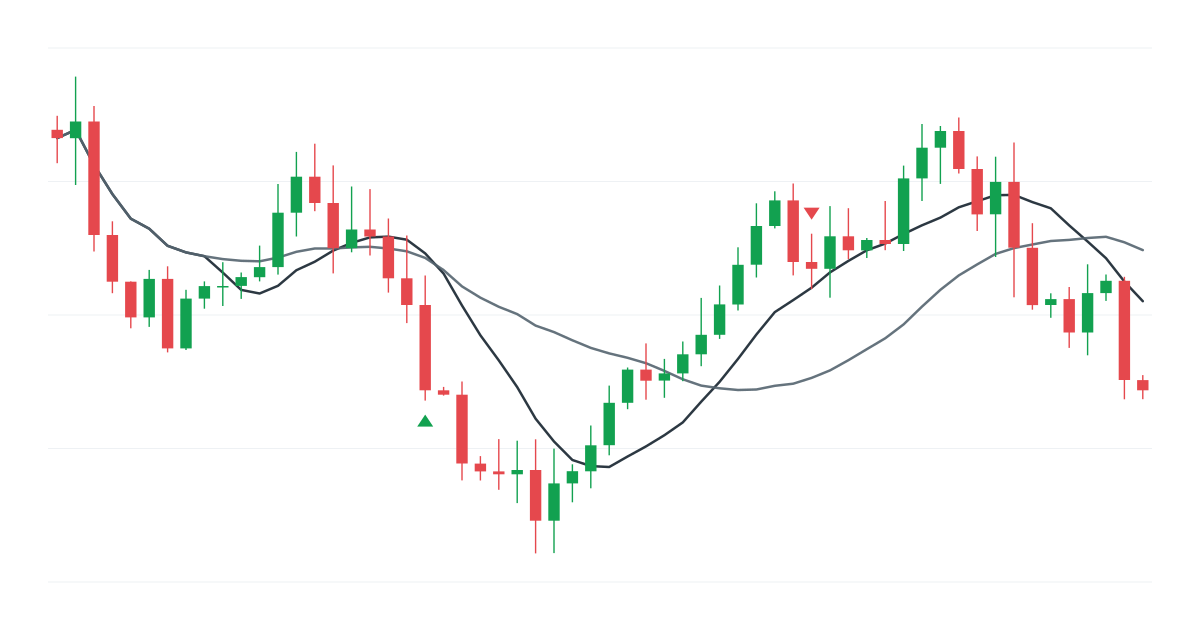
How Bollinger Bands are calculated, what band width tells you about volatility, the squeeze setup, walking the bands in trends, and mean-reversion uses.
The core principles of trend following, typical entry and exit rules, the low win rate and long drawdowns to expect, and how a journal helps you stay disciplined.
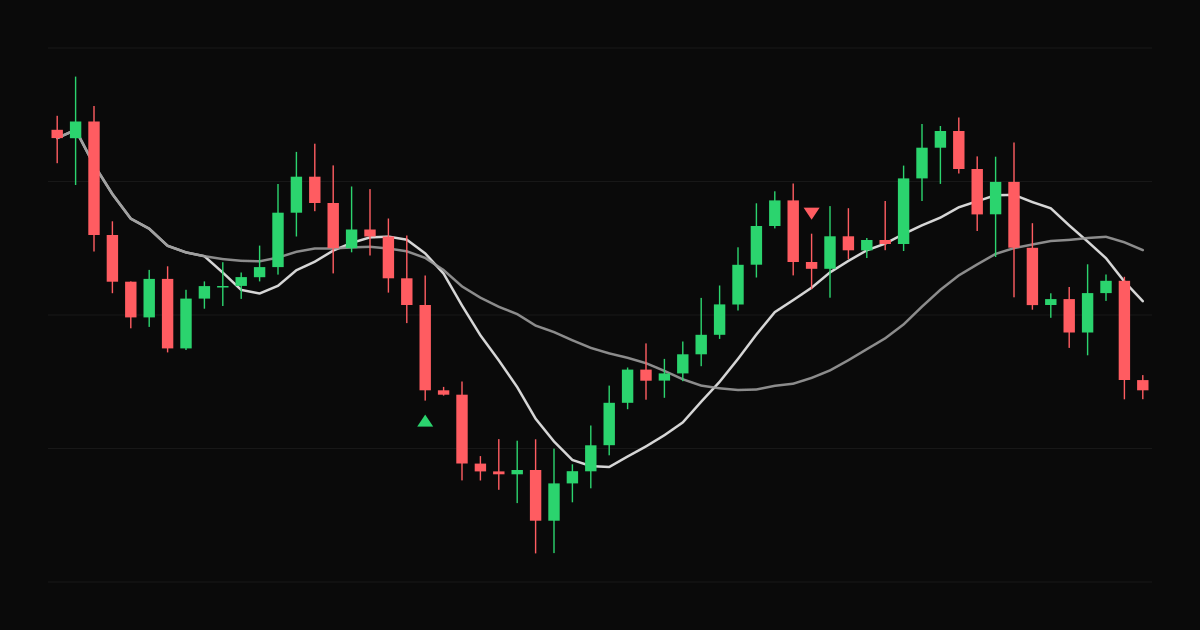
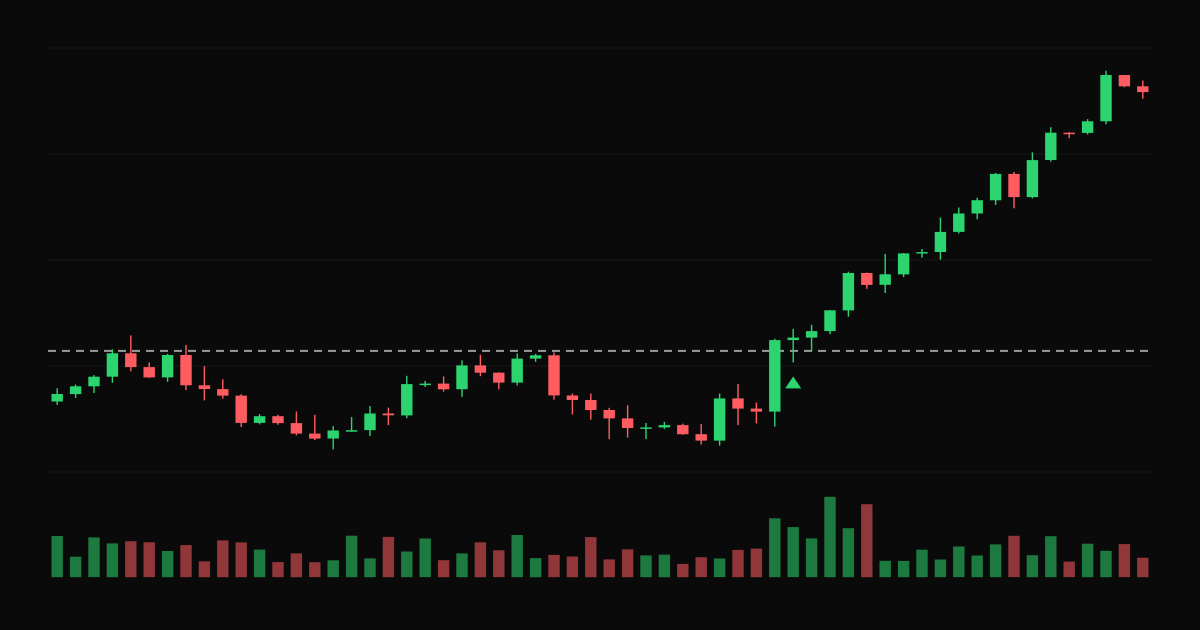
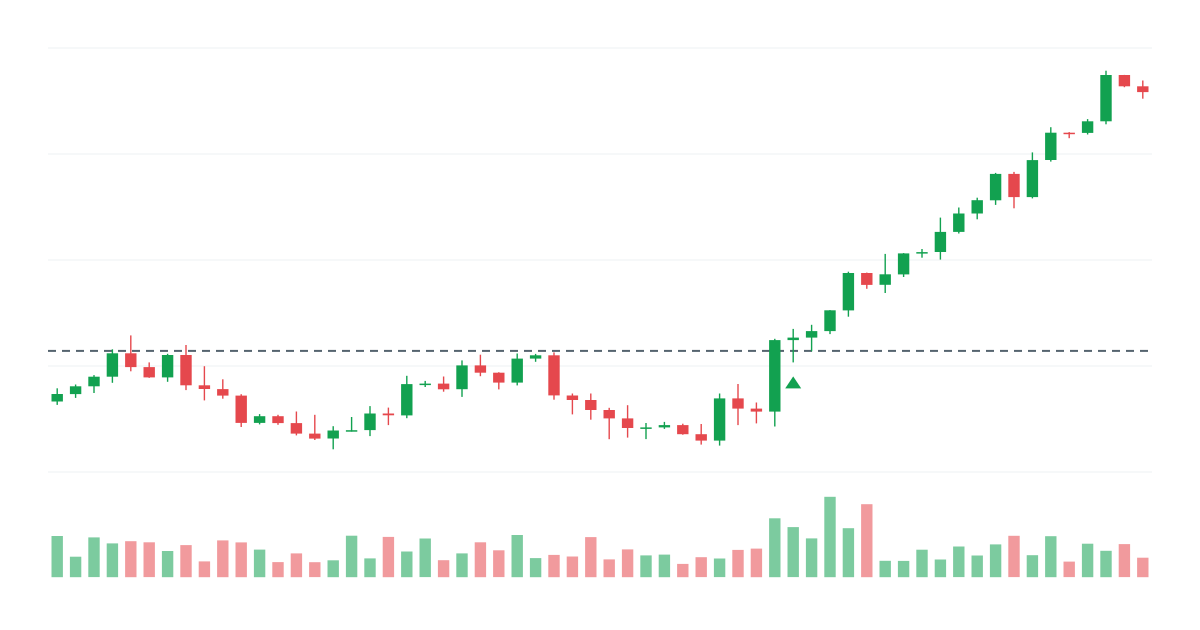
Trend following is one of the oldest systematic trading approaches. The idea is simple: buy what is going up, sell what is going down, cut losses quickly and let winners run. Its history includes many successful managed futures funds. It is also psychologically one of the hardest strategies to stick with.
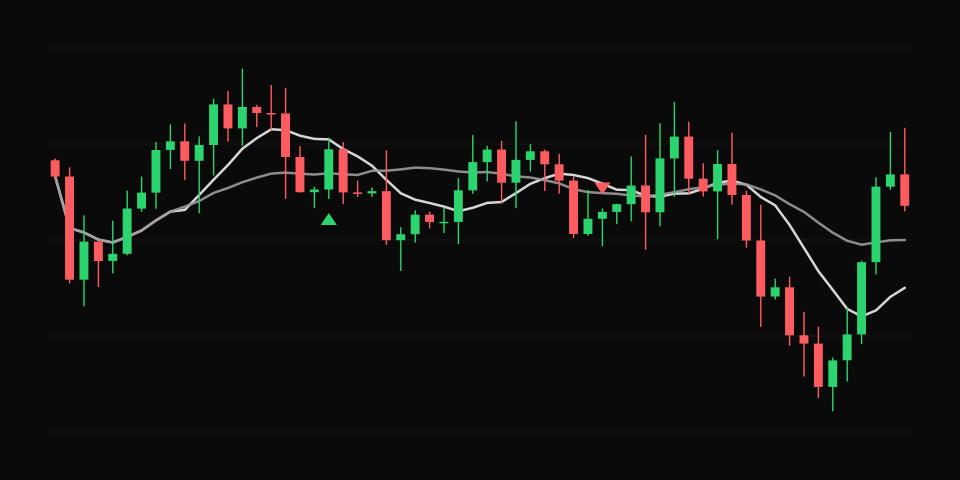
Entries:
Exits:
Trend following typically has:
This profile is hard on traders who judge themselves by win rate or by recent results. See win rate vs profit factor and process vs outcome.
Tag trend trades, track their R distribution and drawdowns, and compare results by setup in the reports. The Sortino ratio often describes trend-following returns more fairly than the Sharpe ratio.
How Bollinger Bands are calculated, what band width tells you about volatility, the squeeze setup, walking the bands in trends, and mean-reversion uses.
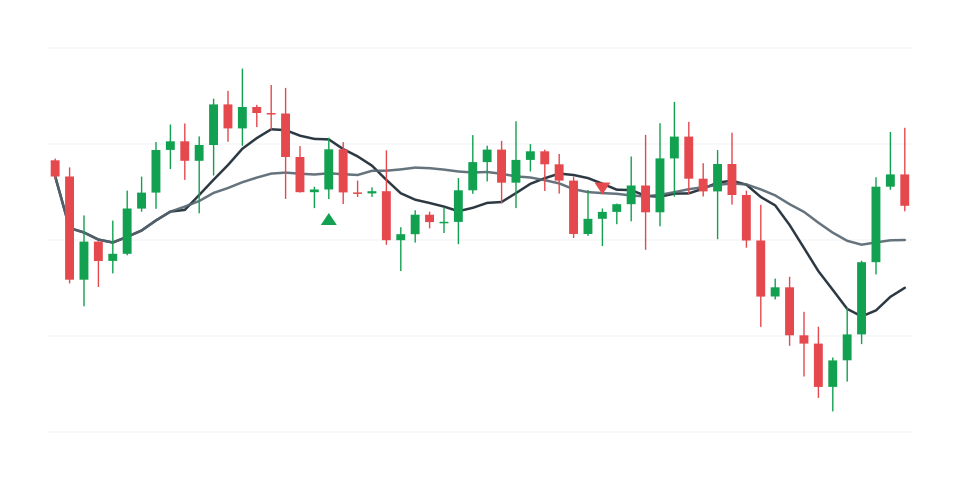
How the opening range breakout strategy works, choosing the range length, entries, stops, targets, filters and how to measure whether ORB works for you.
What a trading plan should include, from goals and markets to setups, risk rules, routines and review, with a template you can adapt.