Performance metrics
Profit Factor Explained: What Is a Good Profit Factor?
How to calculate profit factor, what values are good for day traders and swing traders, its limitations, and how to use it alongside other metrics.
How to calculate trading expectancy in dollars and in R, worked examples, and how to use expectancy to compare setups and decide what to trade.
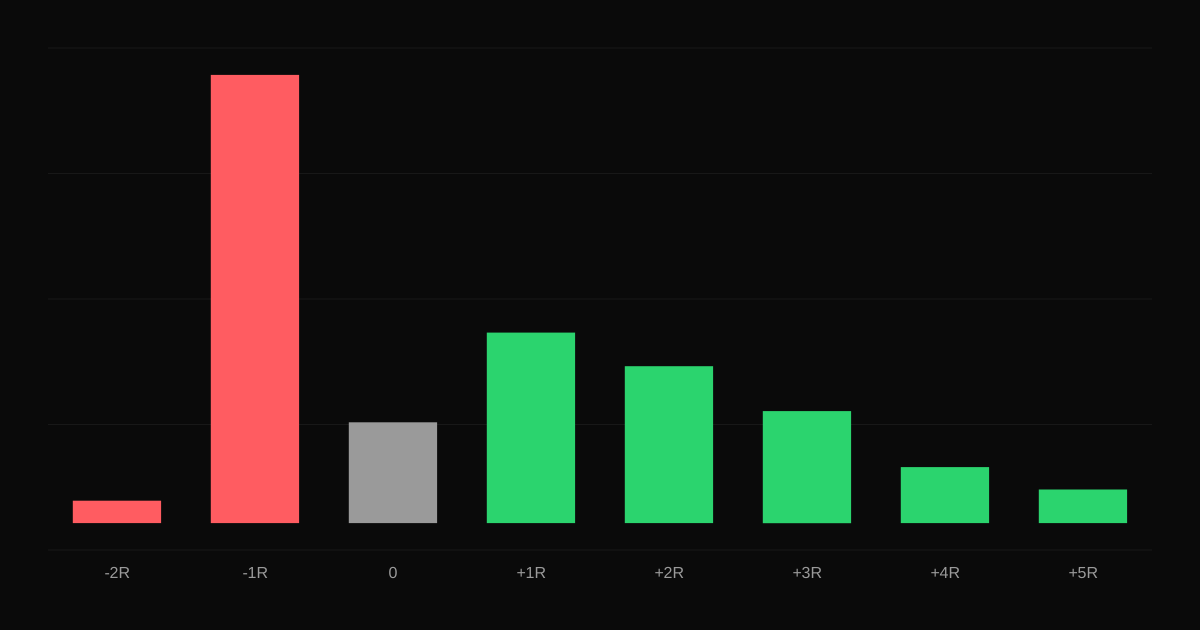
Expectancy is the average amount you can expect to win or lose per trade, based on your results. If it is positive, your strategy has an edge. If it is negative, no amount of discipline or position sizing will make it profitable in the long run. It is the expected value of a trade.
Expectancy = (Win rate × Average win) − (Loss rate × Average loss)
Using average loss as a positive number.
Example: 100 trades, 45 winners averaging $320, 55 losers averaging $210.
Expectancy = (0.45 × $320) − (0.55 × $210) = $144 − $115.50 = $28.50 per trade.
Over 100 trades, that is about $2,850, before considering variance.
Dollars depend on your position size. Expressing expectancy in R-multiples makes it comparable across time and accounts:
Expectancy (R) = Average R-multiple of all trades
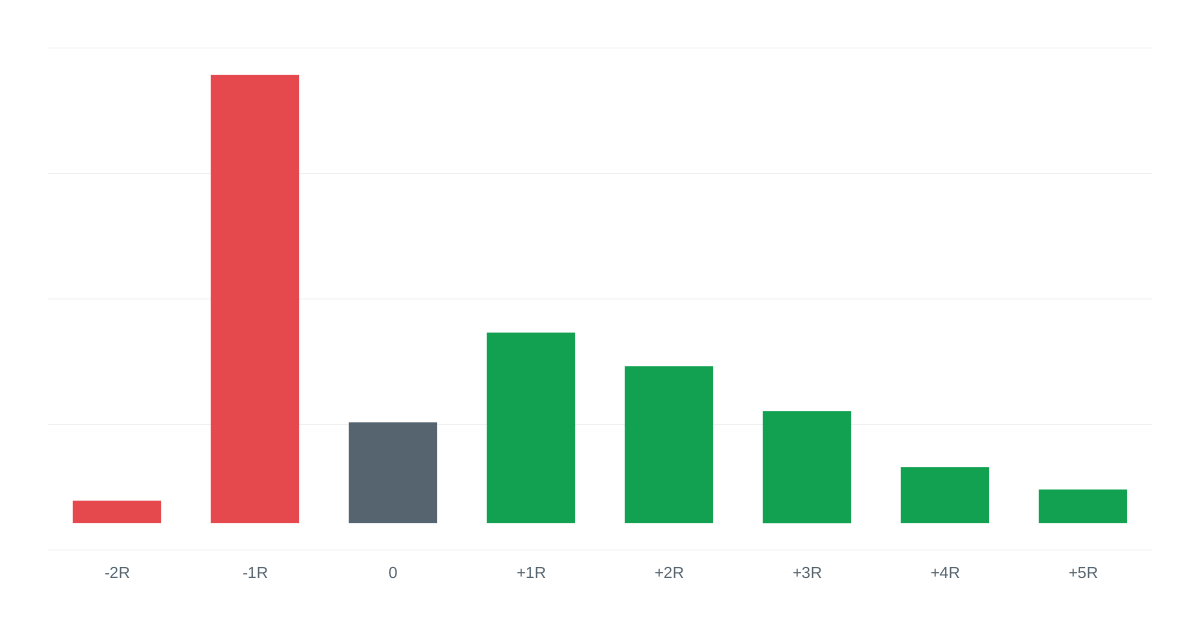
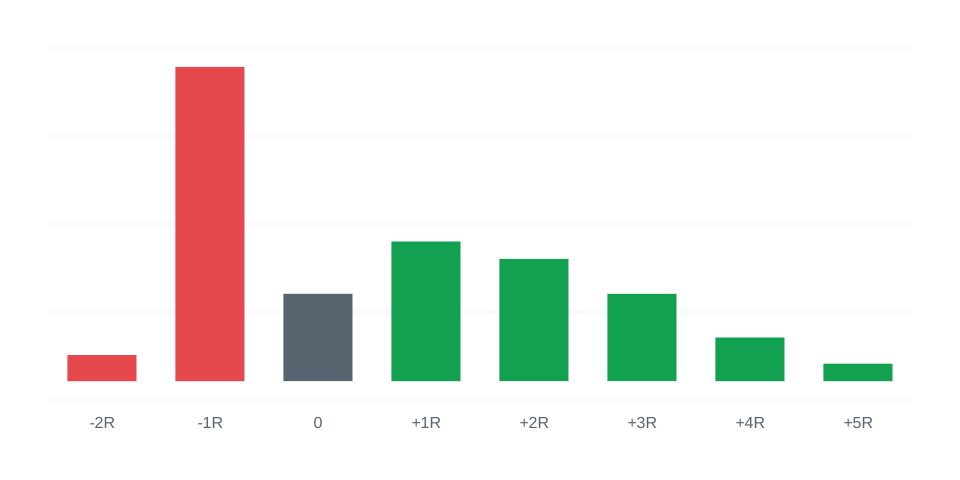
If your average trade is +0.25R, you make a quarter of your risk per trade on average. With $200 of risk per trade, that is $50 per trade. See R-multiples.
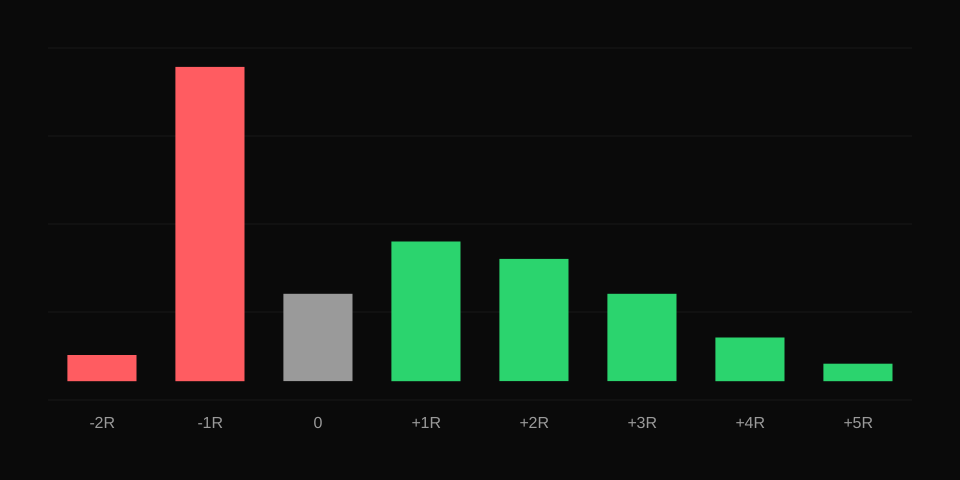
Calculate expectancy separately for:
Often a strategy with modest overall expectancy hides one excellent setup and two poor ones. Trading only the good one can transform your results.
A small expectancy traded often can beat a large expectancy traded rarely. Total expected profit is roughly expectancy times the number of trades. That is also why fees matter: they subtract from every trade's expectancy. See the impact of fees.
Expectancy from 20 trades is a guess. From 200, it starts to mean something. Look at whether expectancy is stable across months before trusting it. See sample size.
Expectancy in dollars and in R is on the statistics page, and you can filter by setup, tag, side or asset to compare expectancy across your trading. Related: win rate vs profit factor.
How to calculate profit factor, what values are good for day traders and swing traders, its limitations, and how to use it alongside other metrics.
How the Sharpe ratio measures risk-adjusted returns, how to calculate it from daily trading returns, what values are typical, and its limitations for active traders.
How the Sortino ratio differs from the Sharpe ratio, how to calculate downside deviation, and when the Sortino ratio gives a fairer picture of a trading strategy.