Trading journal
How to Journal Your Emotions While Trading (and Why It Pays)
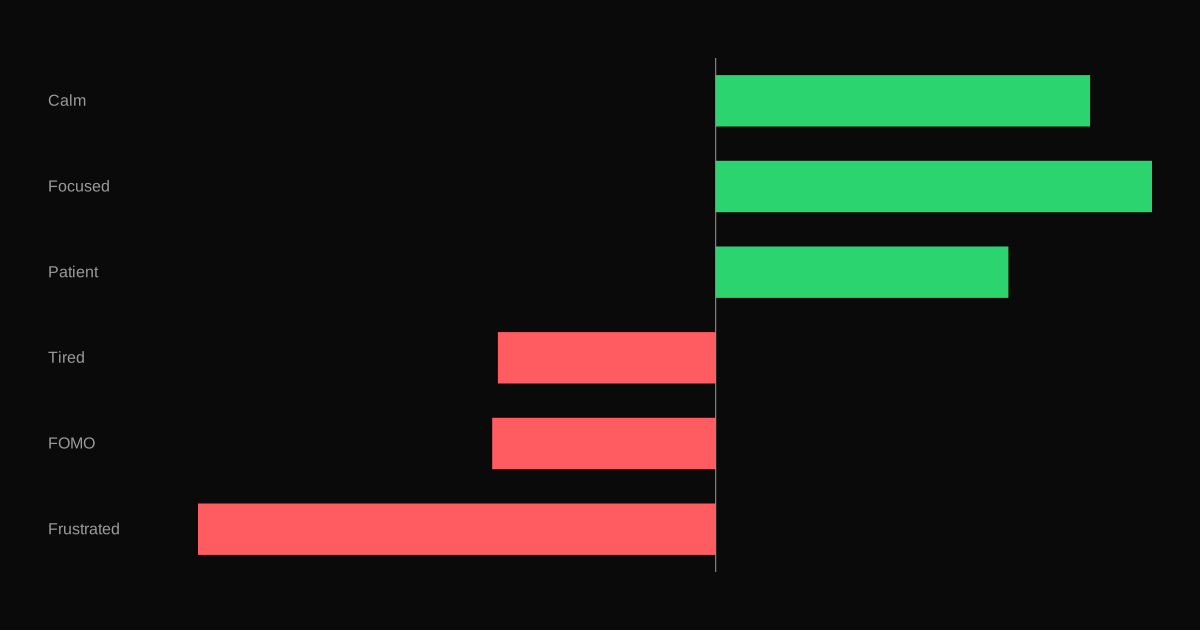
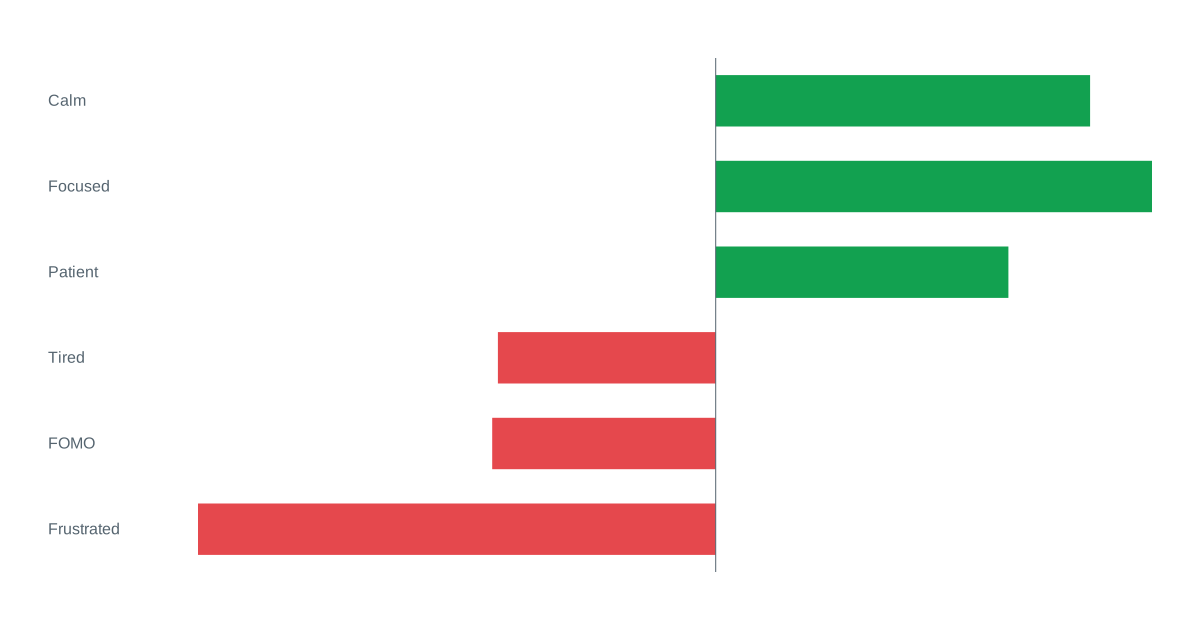
Recording your mood before and after trading reveals how emotions affect your results. Here is a simple method and how to analyze what you find.
Why chart screenshots make your trading journal more useful, what each screenshot should show, and how to review them to find patterns in your entries and exits.
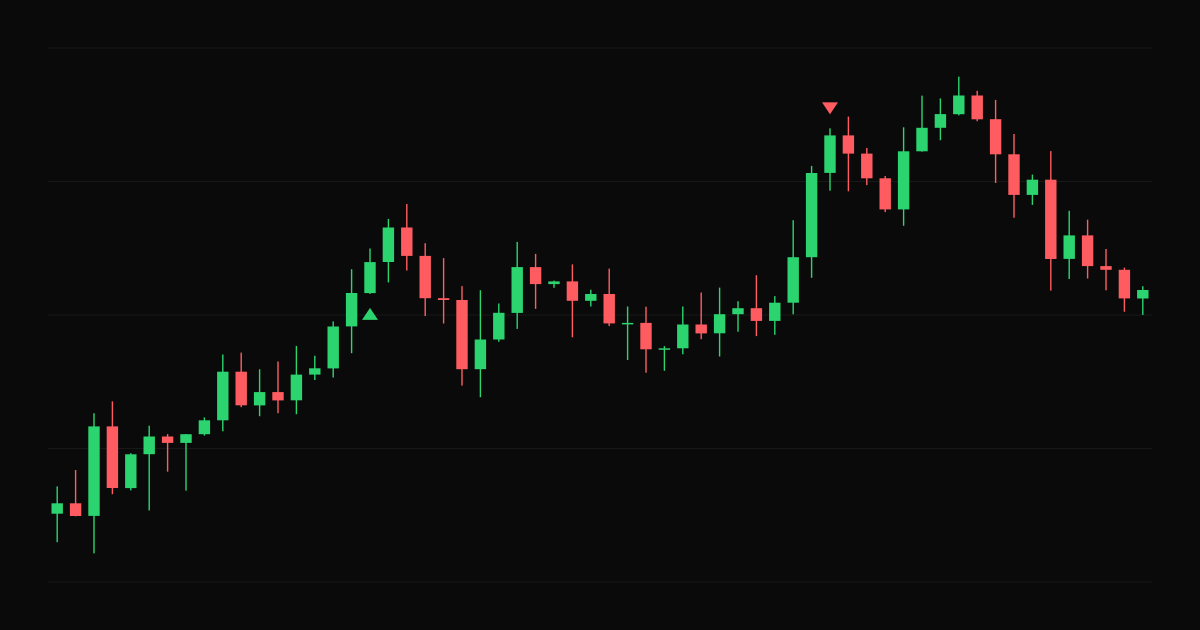
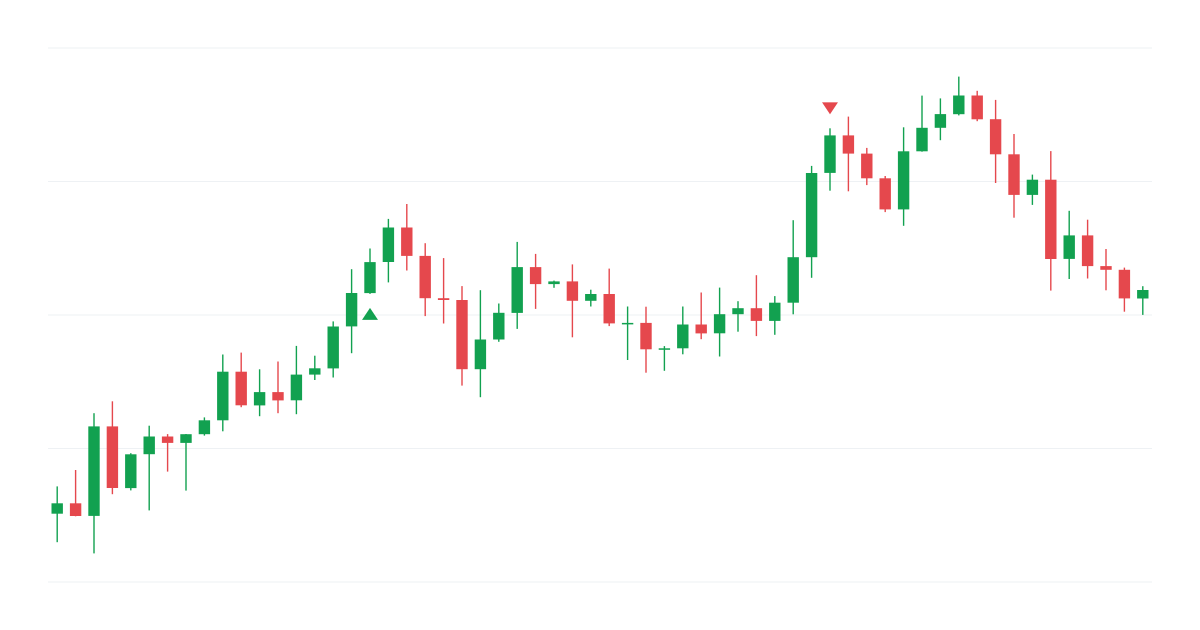
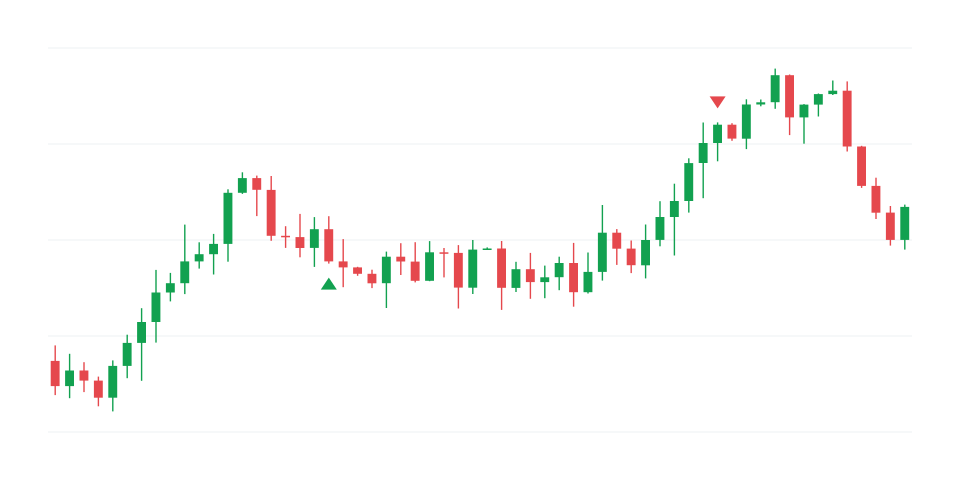
A chart shows what notes cannot. When you review a trade weeks later, a screenshot of the entry and exit tells you in two seconds whether you bought a breakout or chased a move that was already over.
Comparing the two trains your eye. Over time you learn which entry pictures tend to work.
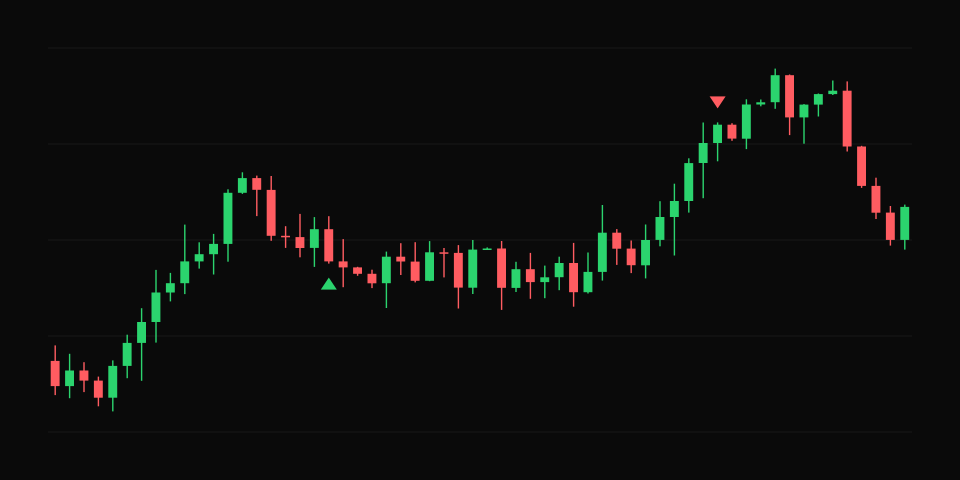
Screenshots become valuable in bulk. Once a month:
Your best screenshots become a playbook: one page per setup with two or three examples of a textbook trade, the rules, and the common mistakes. Before the open, flip through it. It is the visual version of your pre-market checklist.
Taking and filing screenshots by hand is time-consuming. In TradeThink, every trade has a price chart with your entries and exits plotted automatically, so you can review the picture without capturing anything. Use screenshots for the context the chart cannot show, such as Level 2 or a news headline. Add your notes and tags next to the chart.
Recording your mood before and after trading reveals how emotions affect your results. Here is a simple method and how to analyze what you find.
A monthly review routine for traders: the key metrics to track month over month, how to compare months fairly, and how to set goals for the next month.
How to analyze your trading results by hour of the day, why most day traders do best in certain windows, and what to do with what you find.