Trading journal
Find Your Best Trading Hours by Analyzing Results by Time of Day
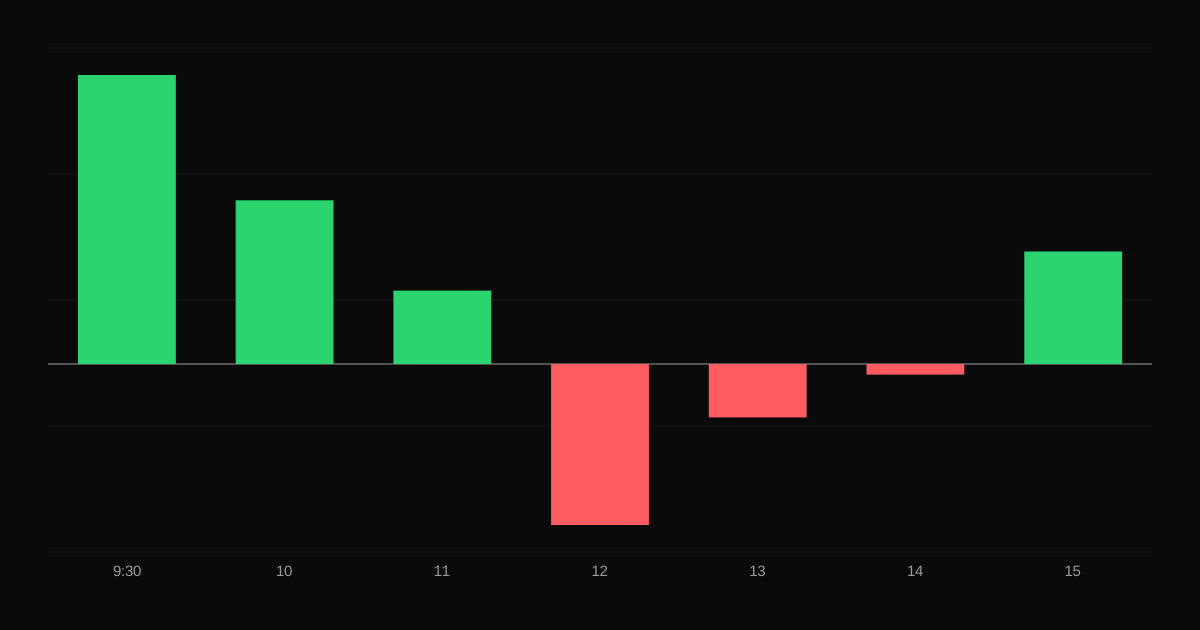
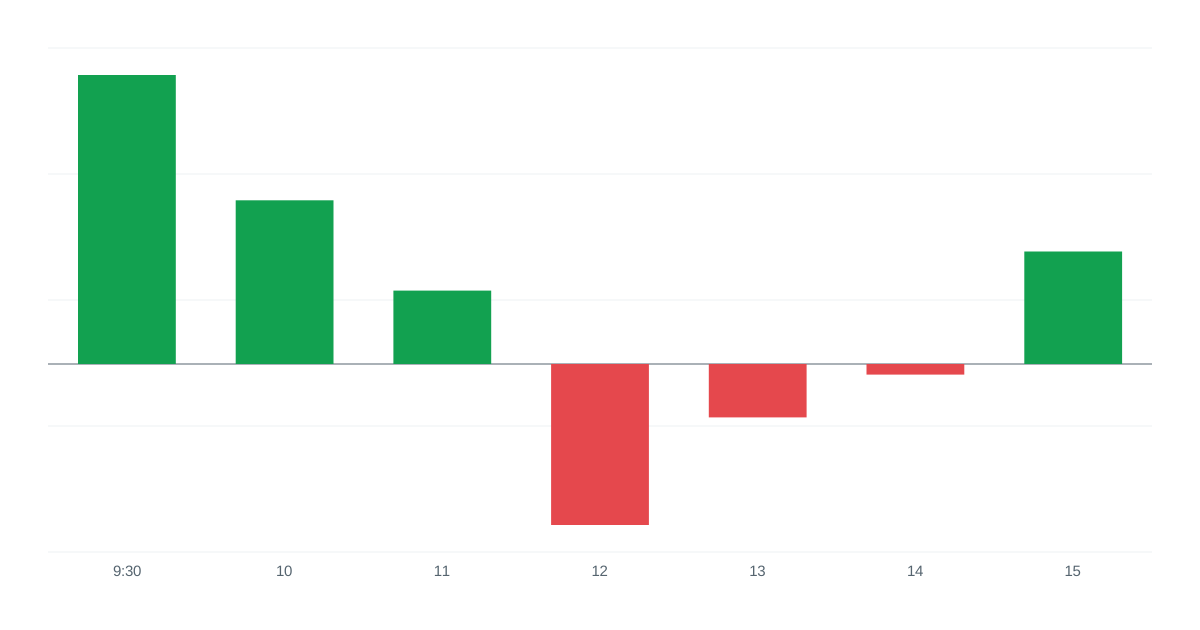
How to analyze your trading results by hour of the day, why most day traders do best in certain windows, and what to do with what you find.
A monthly review routine for traders: the key metrics to track month over month, how to compare months fairly, and how to set goals for the next month.
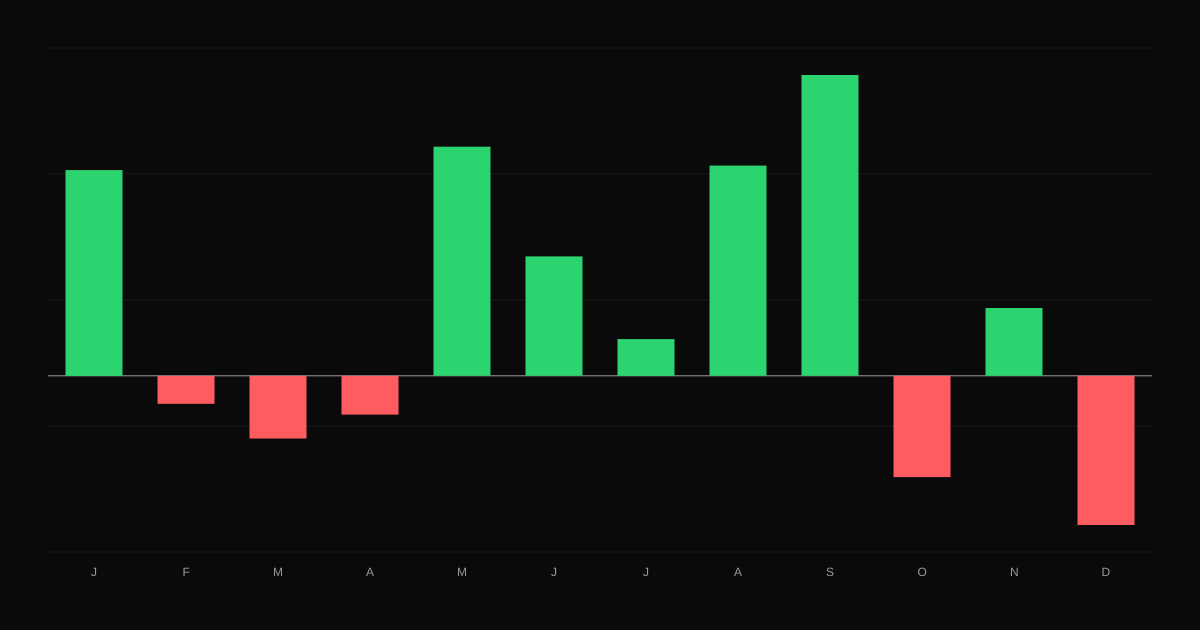
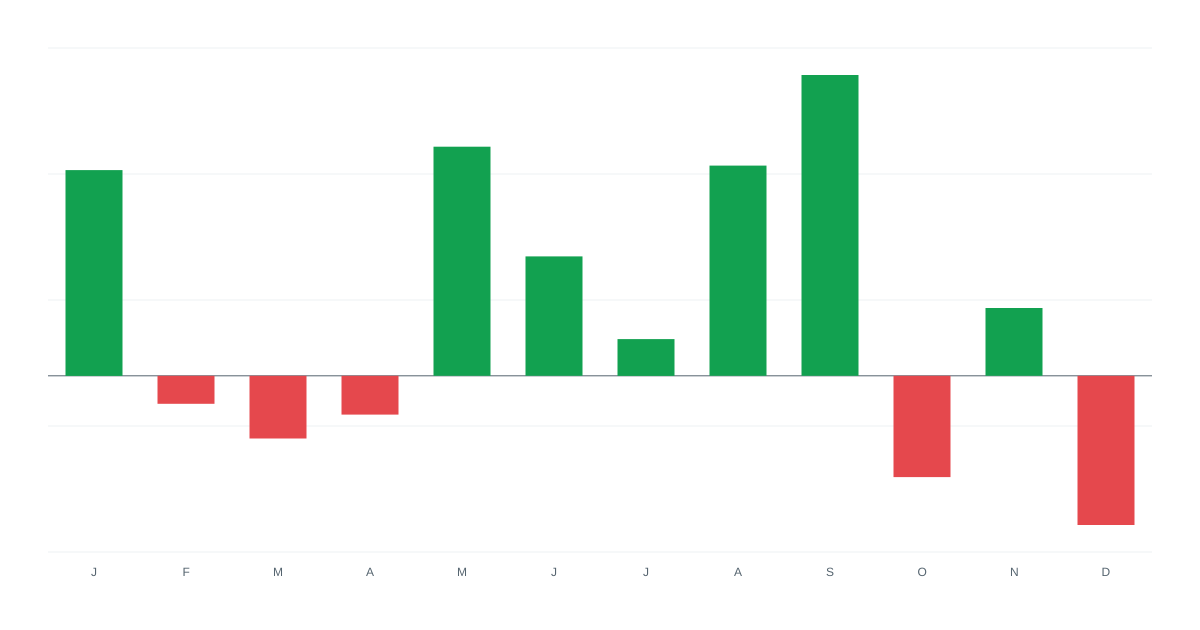
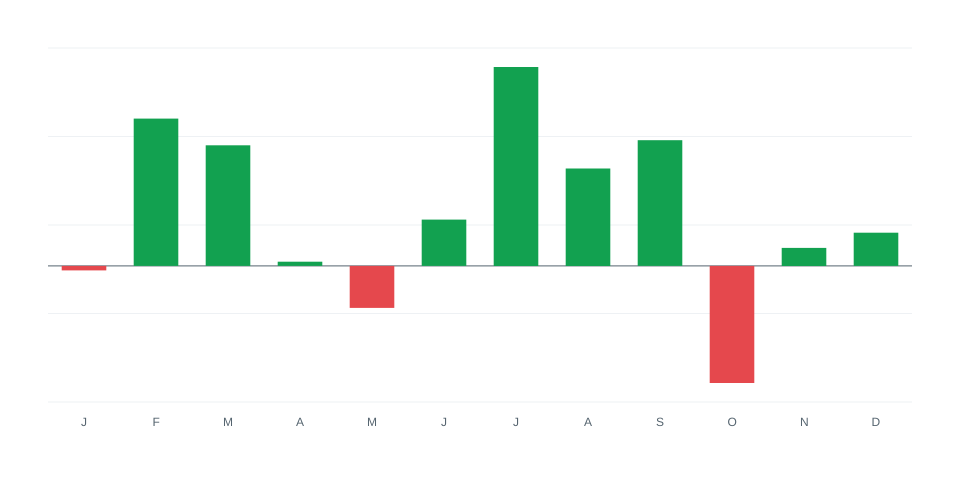
The weekly review catches habits. The monthly review shows whether you are actually improving. A month is long enough to have a meaningful number of trades, and short enough to adjust before a bad trend costs too much.
Track the same numbers every month in a simple table so you can see trends:
| Metric | Why it matters |
|---|---|
| Net P&L after fees | The bottom line |
| Number of trades | Spots overtrading or undertrading |
| Win rate | Shifts often signal a change in market conditions or execution |
| Average win / average loss | The other half of the win rate story |
| Profit factor | Gross profit divided by gross loss |
| Expectancy per trade | What an average trade earns |
| Max drawdown | The worst peak-to-trough drop |
| Fees | As a share of gross profit |
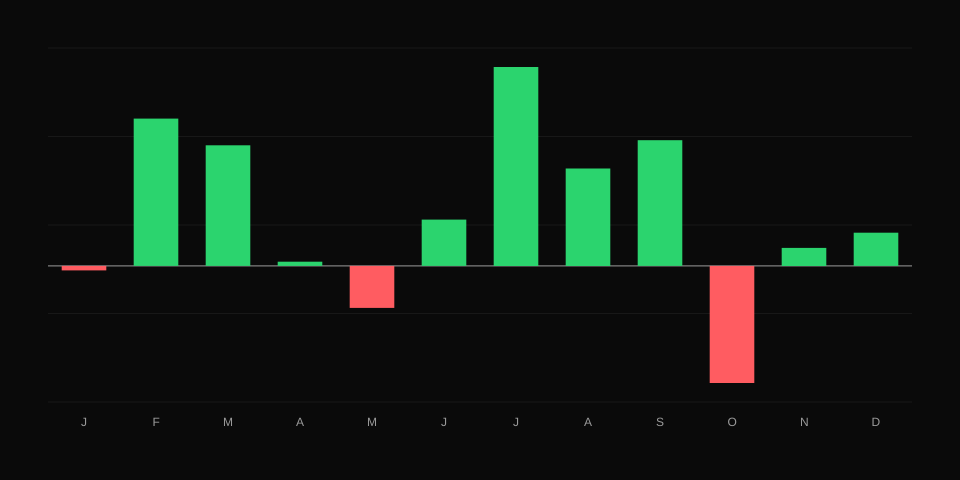
A month's P&L depends on market conditions and on how much you traded. To compare fairly:
Make goals about process, not P&L, because process is what you control:
Your trading P&L is not the whole story. Deposits, withdrawals, fees and interest change your account balance as well. A month-by-month view of cash flow in your trading account shows how much the account grew from trading versus from deposits.
In TradeThink, the reports show results by month, and metric history charts how each number has changed over time, so you can see at a glance whether your win rate or profit factor is trending up. Spend your review time on the questions, not on the arithmetic.
How to analyze your trading results by hour of the day, why most day traders do best in certain windows, and what to do with what you find.
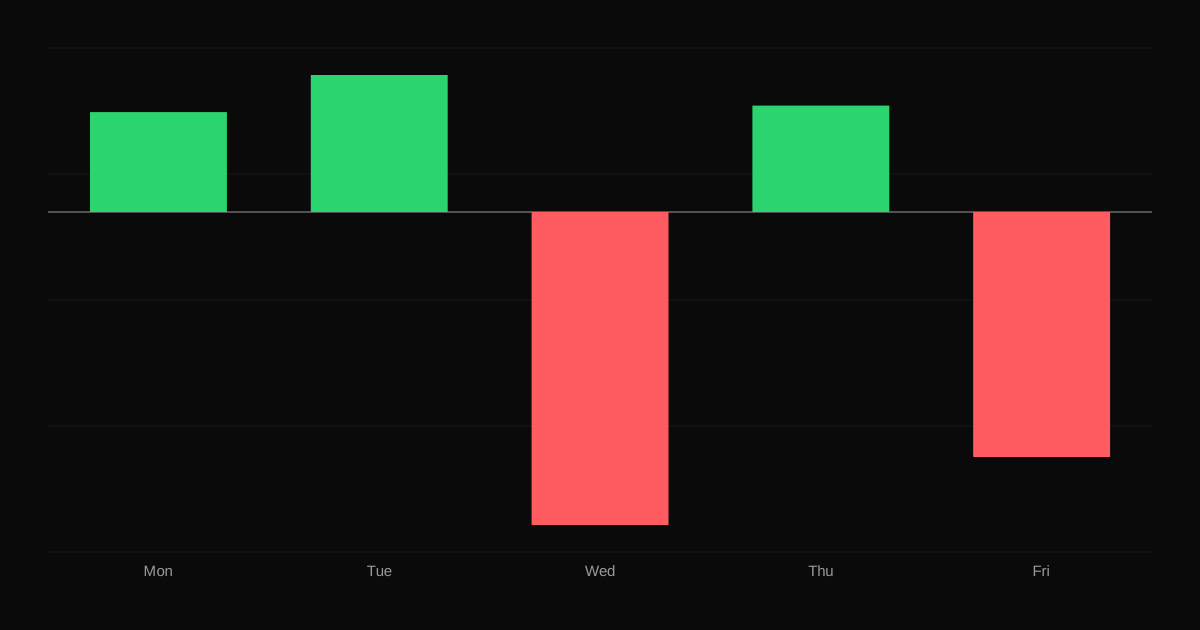
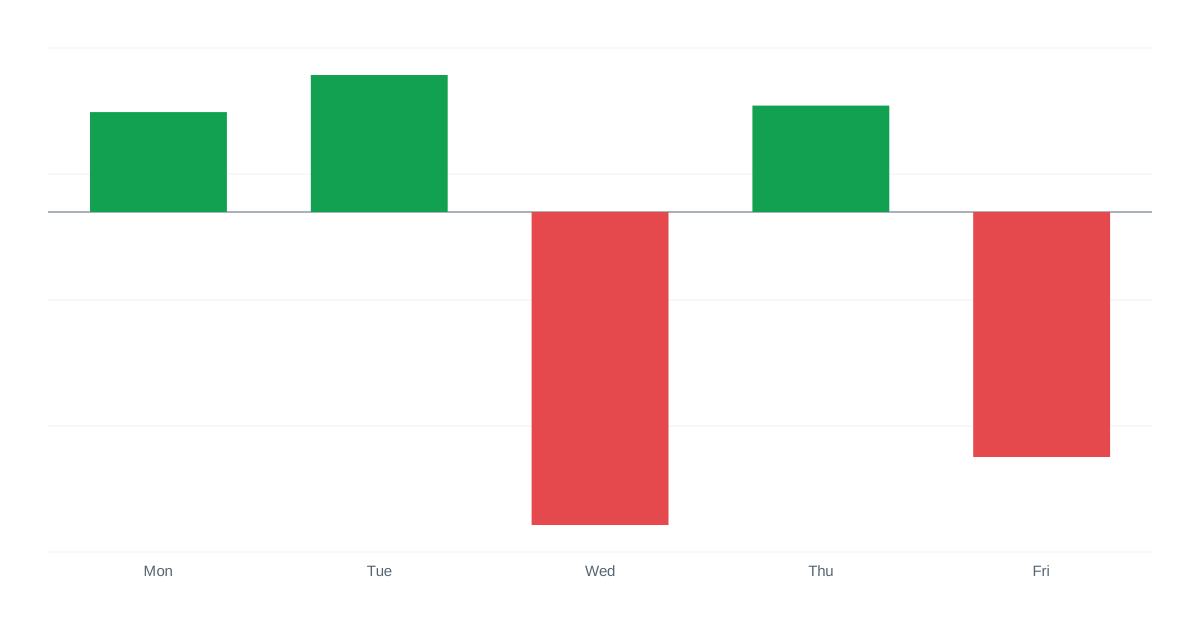
How to analyze your trading results by weekday, the common patterns traders find, and how to use them without overfitting.
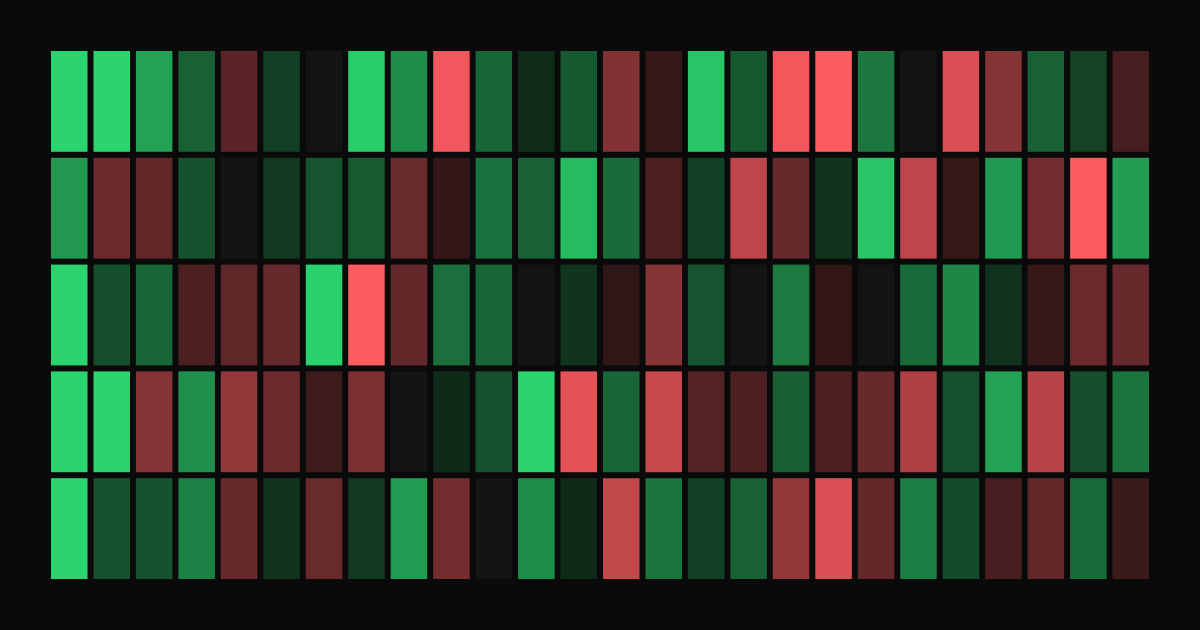
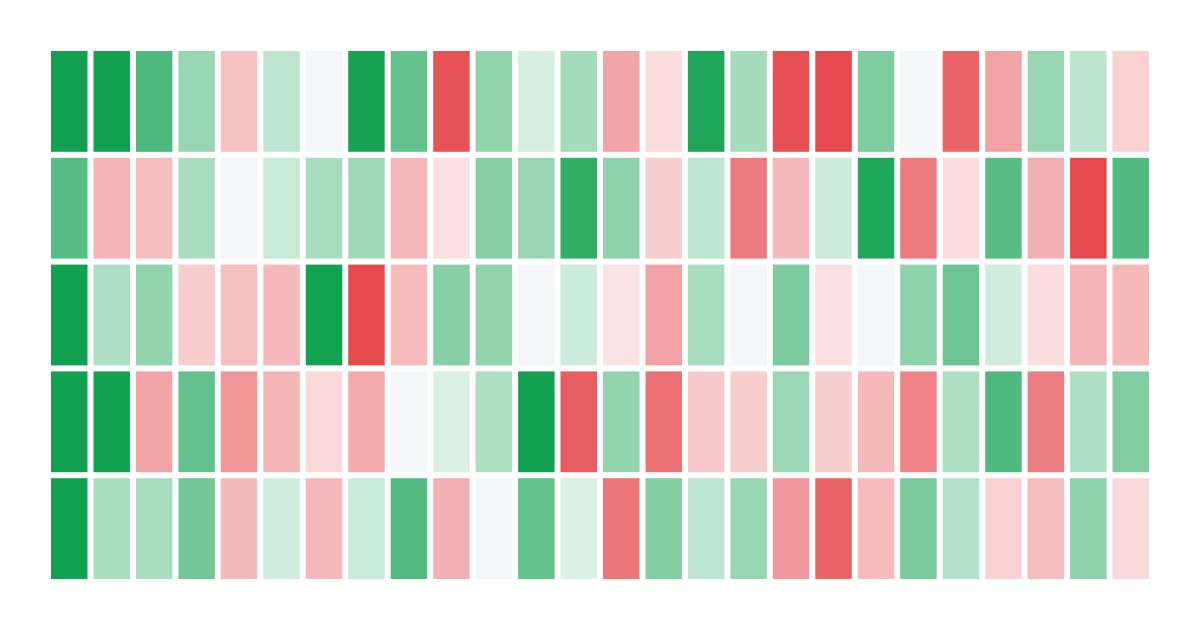
How a P&L calendar heatmap helps you spot losing streaks, overtrading and patterns in your trading, and what to look for when you review it.