Performance metrics
Trading Expectancy: The Formula That Tells You If You Have an Edge
How to calculate trading expectancy in dollars and in R, worked examples, and how to use expectancy to compare setups and decide what to trade.
Why a high win rate can still lose money, how profit factor captures the full picture, and how to read the two metrics together to judge your trading.
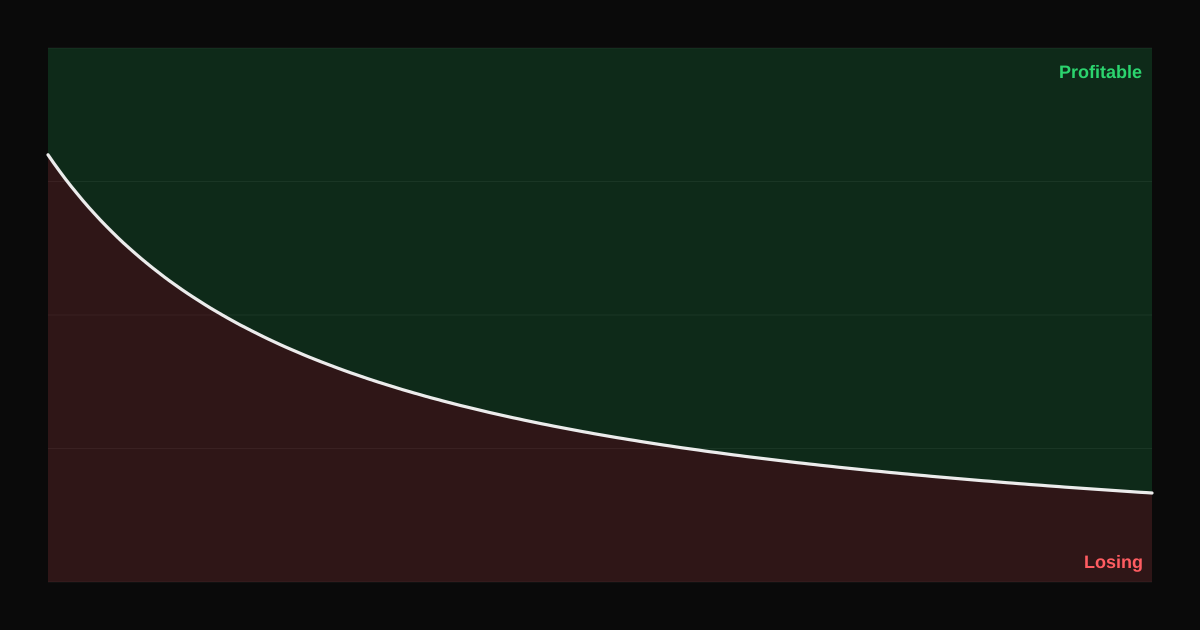
Win rate is the first number most traders look at, and the most misleading one on its own. A 70% win rate can lose money. A 35% win rate can make a lot. To know whether you have an edge, you need to see how much you win when you win, compared with how much you lose when you lose.
Win rate = Winning trades ÷ Total trades
It tells you how often you are right. It says nothing about the size of wins and losses.
Profit factor = Gross profit ÷ Gross loss
Gross profit is the sum of all winning trades; gross loss is the sum of all losing trades, as a positive number. A profit factor above 1 means you made money; below 1, you lost. See profit factor explained.
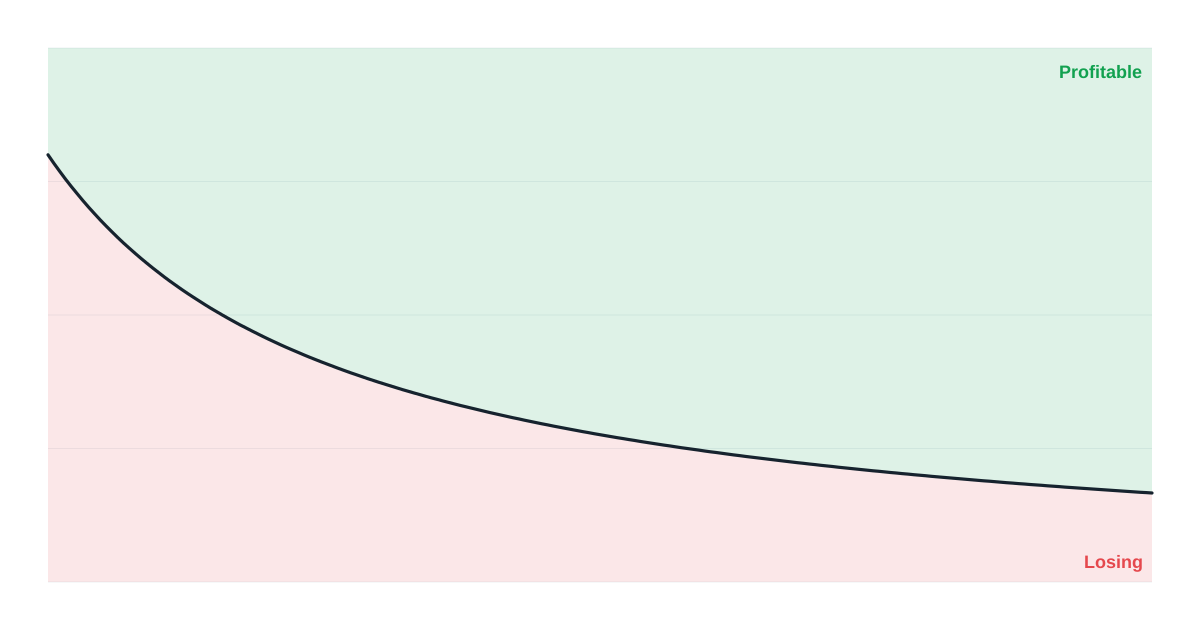
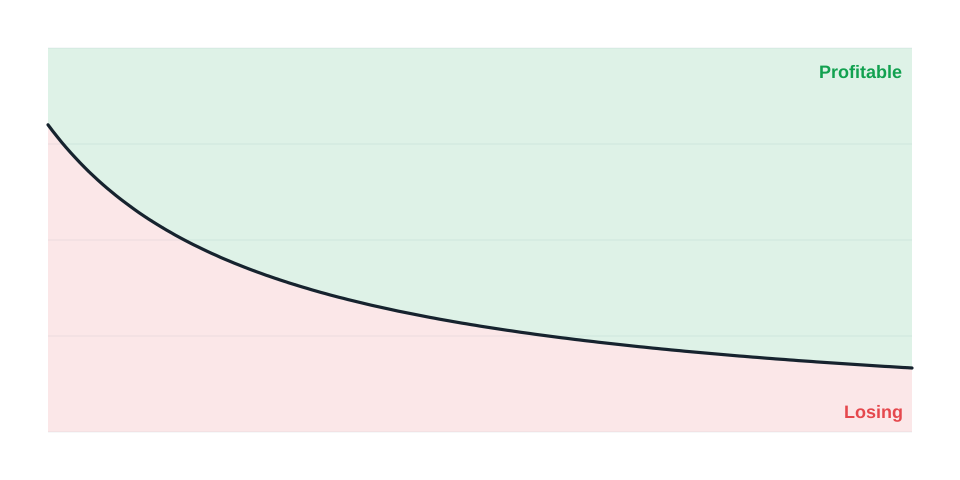
Profit factor combines win rate and payoff:
Profit factor = (Win rate × Average win) ÷ (Loss rate × Average loss)
So the same profit factor can come from very different styles:
| Style | Win rate | Avg win | Avg loss | Profit factor |
|---|---|---|---|---|
| Scalper | 70% | $100 | $180 | 1.30 |
| Swing trader | 45% | $300 | $190 | 1.29 |
| Trend follower | 30% | $600 | $200 | 1.29 |
All three have a similar edge. Their win rates could hardly be more different.
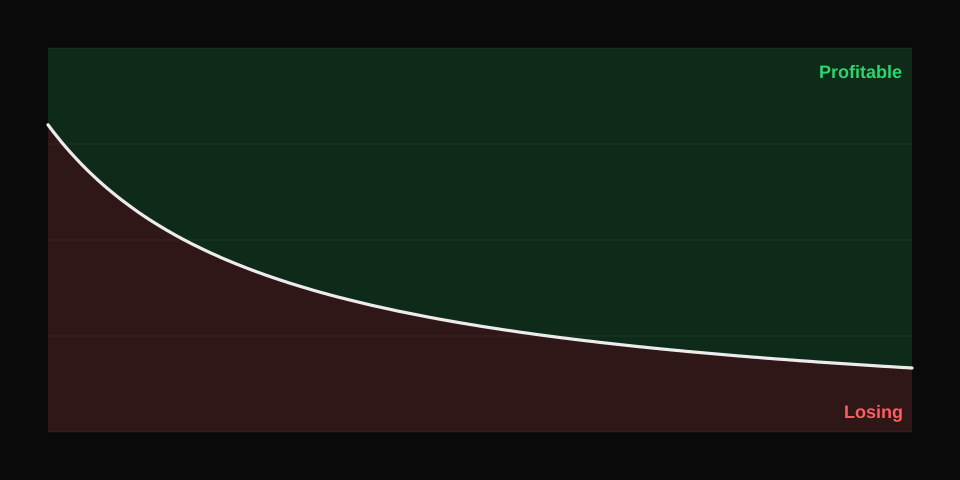
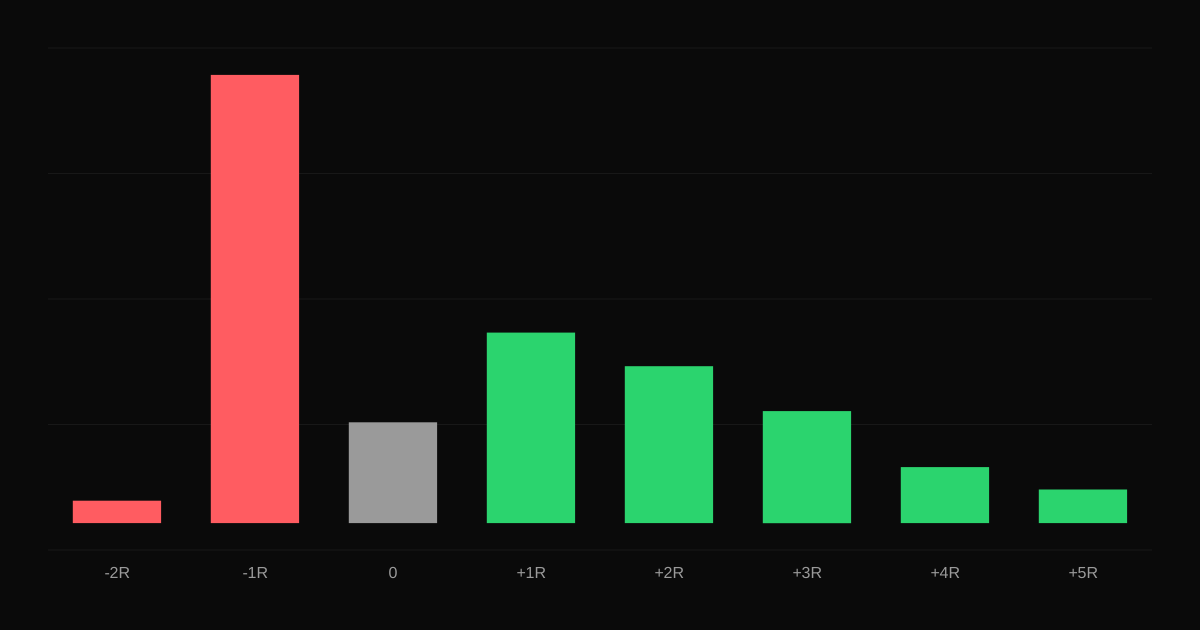
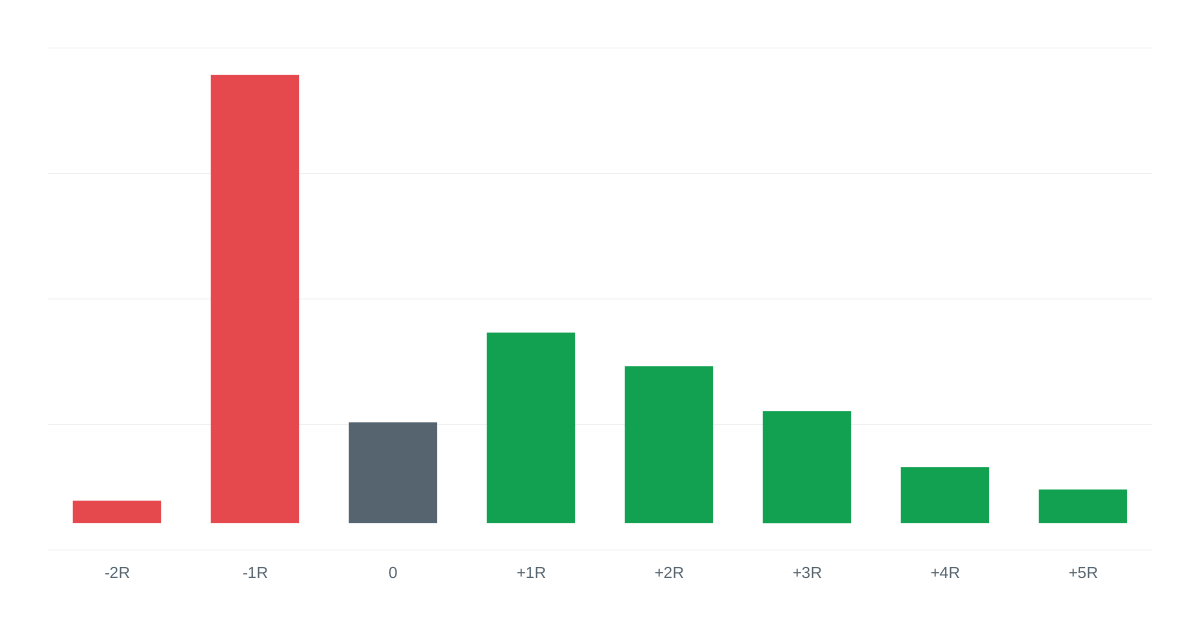
Watch both, plus expectancy, which tells you what an average trade earns. A practical reading:
The statistics page shows win rate, profit factor, average win, average loss and expectancy together, and metric history charts how each one changes over time. Filter by setup to see which setups carry your edge.
How to calculate trading expectancy in dollars and in R, worked examples, and how to use expectancy to compare setups and decide what to trade.
How to calculate profit factor, what values are good for day traders and swing traders, its limitations, and how to use it alongside other metrics.
How the Sharpe ratio measures risk-adjusted returns, how to calculate it from daily trading returns, what values are typical, and its limitations for active traders.