Strategy and analysis
Opening Range Breakout (ORB): A Day Trading Strategy Explained
How the opening range breakout strategy works, choosing the range length, entries, stops, targets, filters and how to measure whether ORB works for you.
How Bollinger Bands are calculated, what band width tells you about volatility, the squeeze setup, walking the bands in trends, and mean-reversion uses.
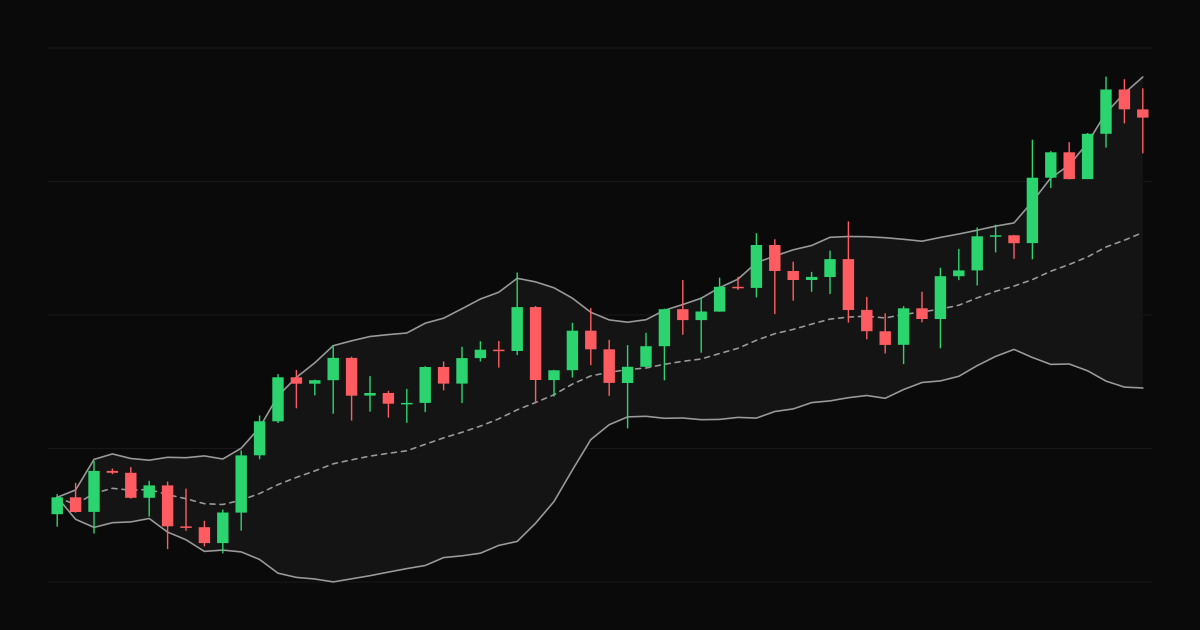
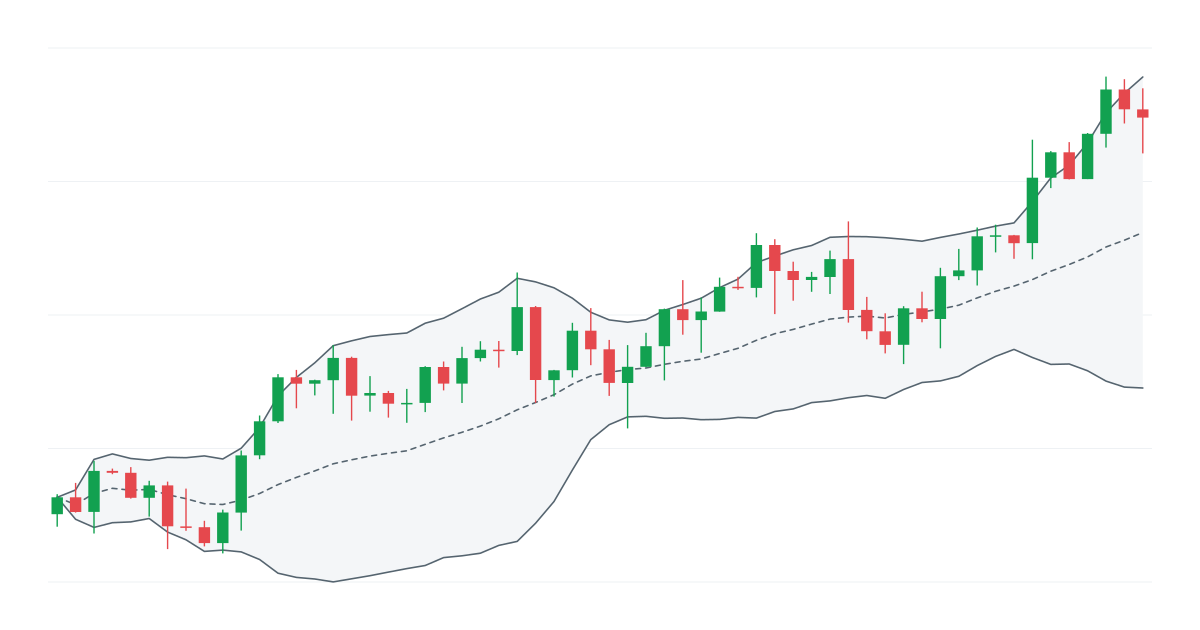
Bollinger Bands, developed by John Bollinger in the 1980s, place a band above and below a moving average at a distance based on recent volatility. When volatility rises, the bands widen. When it falls, they narrow.
The standard settings are:
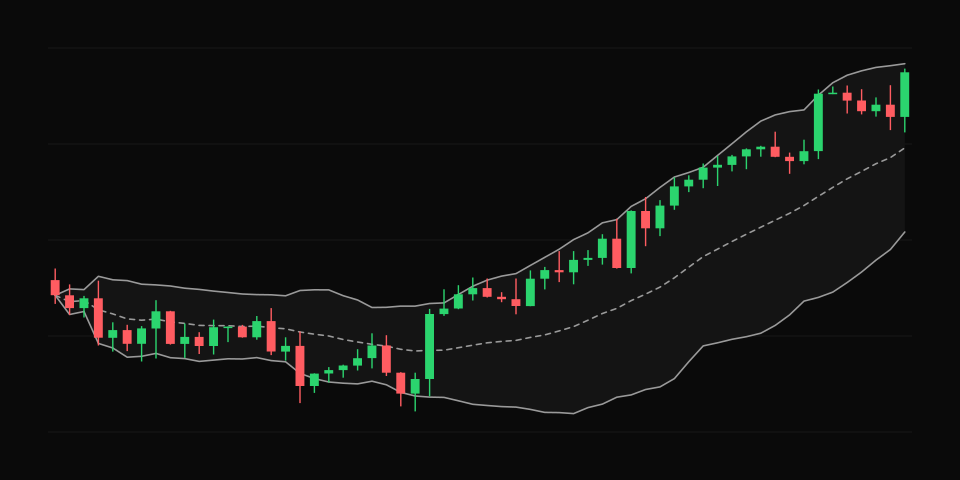
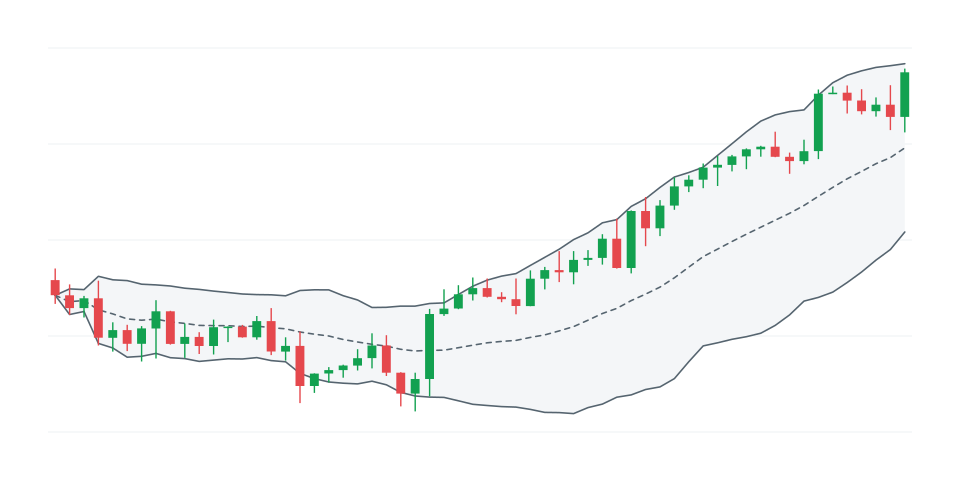
Band width shows whether the market is quiet or active. Low volatility tends to be followed by higher volatility, and the reverse. That is the basis of the squeeze.
Price near the upper band is high relative to its recent range; near the lower band, low. This is relative, not a signal by itself.
When the bands narrow to their tightest in some time, volatility is compressed. Traders watch for a breakout from the squeeze, using other cues such as volume or a level break for direction. See breakout trading.
In strong trends, price can ride along the upper (or lower) band for many bars. Selling simply because price touched the upper band fights the trend. John Bollinger himself has stressed that a touch of a band is not a signal on its own.
In ranging markets, some traders buy near the lower band and sell near the upper band, targeting the middle band. This works best when the larger trend is flat, and poorly when a trend begins.
Tag trades by setup: "squeeze breakout", "band walk", "mean reversion". The three behave very differently, and your results will tell you which suits you. In TradeThink, compare them in the reports and review entries on the price chart. Related: ATR stop loss, another volatility-based tool.
How the opening range breakout strategy works, choosing the range length, entries, stops, targets, filters and how to measure whether ORB works for you.
What a trading plan should include, from goals and markets to setups, risk rules, routines and review, with a template you can adapt.
What backtesting tells you, what it cannot, why live trading results differ, and how a trading journal closes the gap between a strategy on paper and in practice.