Risk management
Risk of Ruin: The Probability of Blowing Up Your Account
What risk of ruin means in trading, the factors that drive it, and how risk per trade, win rate and payoff ratio change your chance of a catastrophic drawdown.
How to use the average true range (ATR) to set stop losses and position sizes that adapt to volatility, with formulas, multipliers and examples.
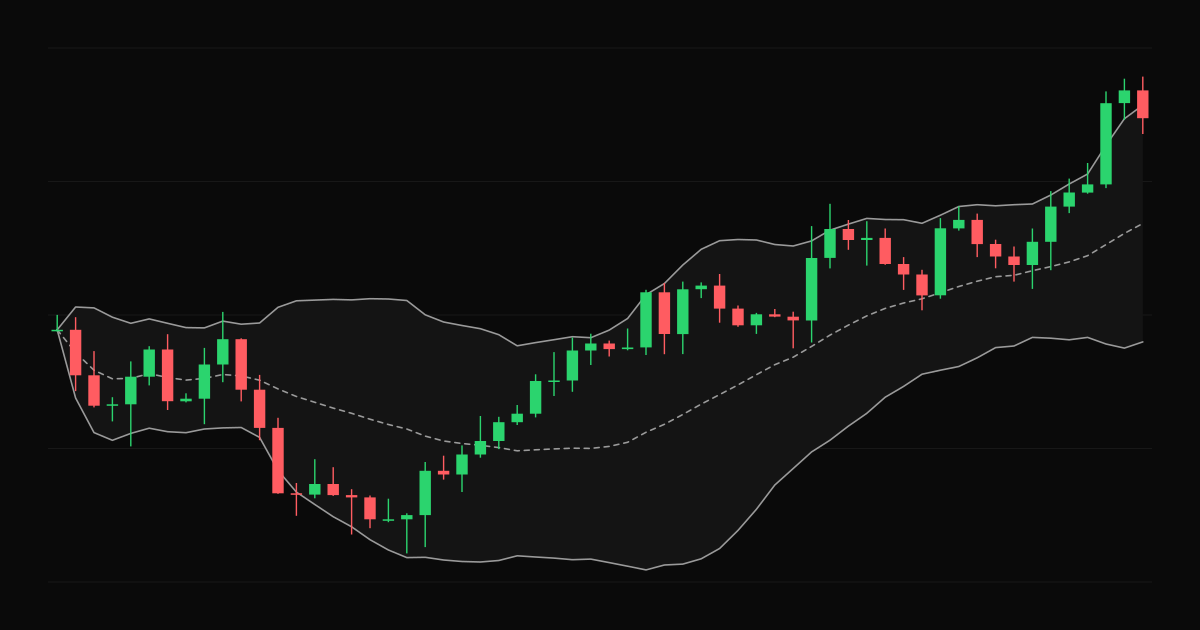
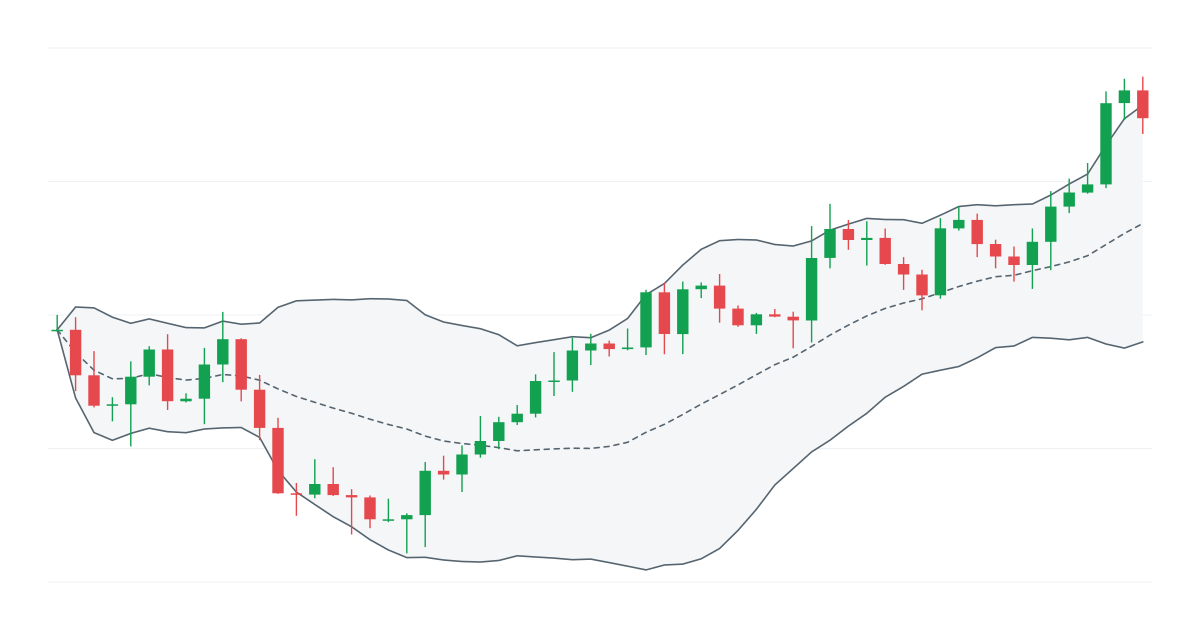
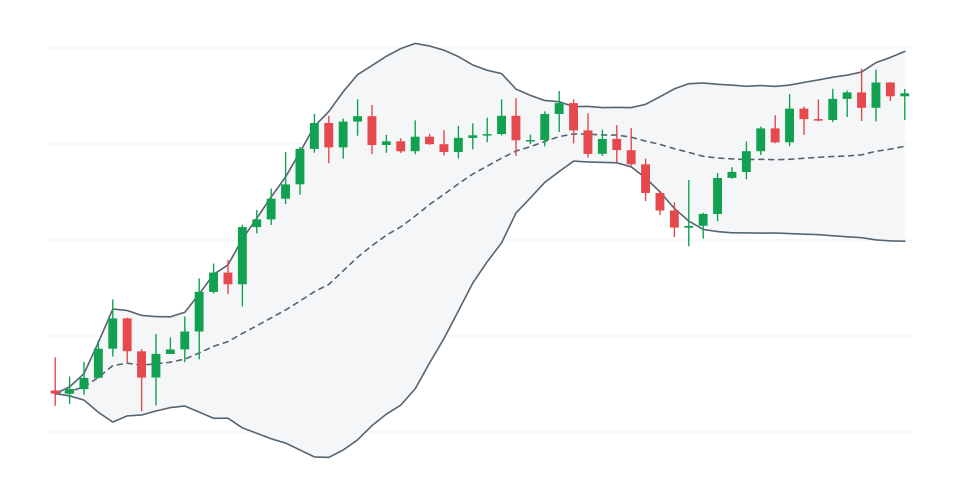
A $1 stop on a stock that moves $5 a day will be hit by noise. A $1 stop on a stock that moves $0.50 a day is very wide. The average true range (ATR) measures how much an instrument typically moves, so you can set stops that fit its personality.
The true range for a period is the largest of:
Including the previous close captures gaps. ATR is the average of the true range over a number of periods, commonly 14. J. Welles Wilder introduced it in 1978.
Place your stop a multiple of ATR away from entry:
Long stop = Entry − (k × ATR)
Common multipliers are 1.5 to 3. A smaller multiplier keeps losses smaller but gets stopped out more often. A larger one gives the trade room but costs more when it fails.
Example: entry $80, 14-day ATR $2.40, multiplier 2. Stop = $80 − $4.80 = $75.20.
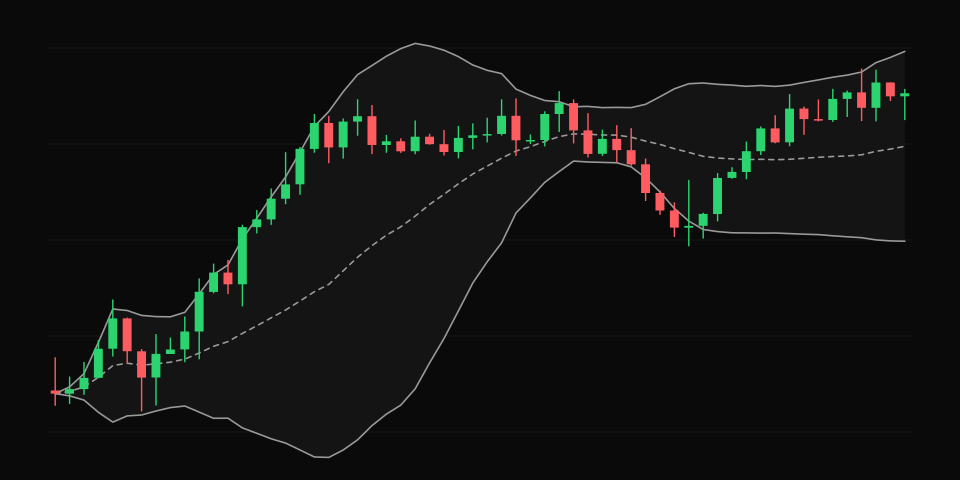
ATR stops combine naturally with fixed-risk position sizing. With $500 of risk and a stop $4.80 away, size = $500 ÷ $4.80 ≈ 104 shares. A more volatile stock gets a wider stop and fewer shares; a quieter one gets a tighter stop and more shares. Your dollar risk stays the same. See position sizing.
ATR alone ignores the chart. A good practice is to find the structural level first, such as the swing low, and use ATR to check the stop is not unreasonably tight. Placing the stop a fraction of an ATR beyond the level also helps avoid the obvious stop clusters. See where to place a stop loss.
You can also trail a stop at a multiple of ATR below the highest price since entry. The stop rises with the trade and never moves down. This is sometimes called a chandelier stop. See trailing stops.
Use the ATR of the timeframe you trade. A day trader using a 5-minute chart should use the 5-minute ATR for stops, and perhaps the daily ATR as context for how far the stock might move in the day.
Check your stopped-out trades: how many were hit by a move smaller than one ATR? If many were, your stops are probably inside the noise. TradeThink shows the price chart for each trade with your executions, and MAE shows how far trades moved against you.
What risk of ruin means in trading, the factors that drive it, and how risk per trade, win rate and payoff ratio change your chance of a catastrophic drawdown.
What R-multiples are, how to calculate them, and why measuring trades in units of risk makes your results comparable, honest and easier to improve.
How correlated positions multiply your risk, how to spot hidden correlation across stocks, sectors, currencies and crypto, and how to size around it.