Performance metrics
Average Win vs Average Loss: The Ratio Behind Every Profitable Trader
How to calculate your average win and average loss, why their ratio matters as much as your win rate, and how to improve it.
How the Sortino ratio differs from the Sharpe ratio, how to calculate downside deviation, and when the Sortino ratio gives a fairer picture of a trading strategy.
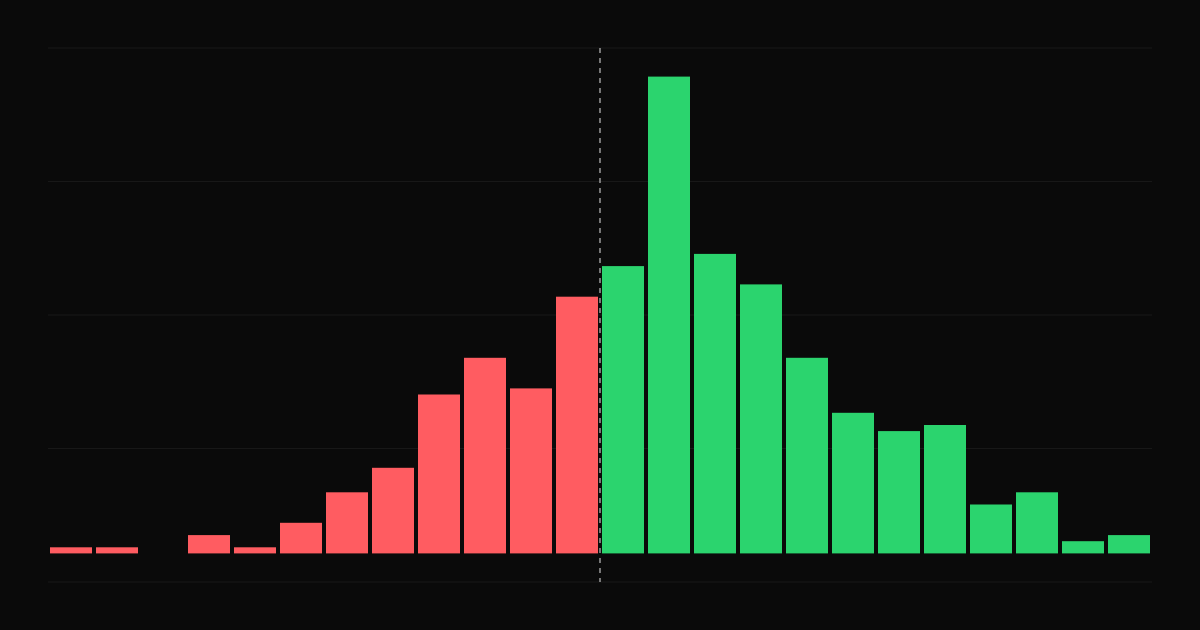
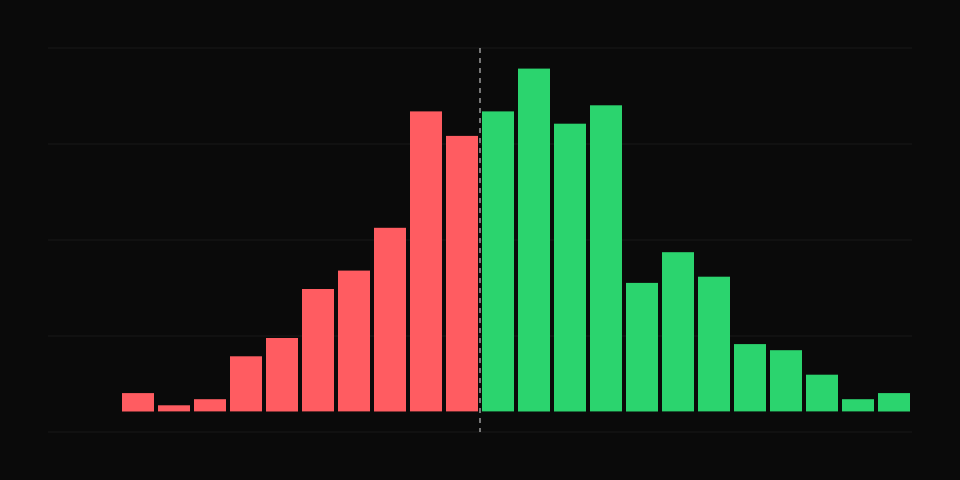
The Sharpe ratio penalizes all volatility, including big winning days. For most traders, upside volatility is welcome. The Sortino ratio, developed by Frank Sortino, only counts the volatility that hurts: returns below a target.
Sortino ratio = (Average return − Target return) ÷ Downside deviation
The target is often zero or the risk-free rate. Downside deviation is calculated like a standard deviation, but only from returns below the target, with returns above it counted as zero.
| Sharpe | Sortino | |
|---|---|---|
| Volatility counted | All | Only below target |
| Penalizes big winning days | Yes | No |
| Best for | Roughly symmetrical returns | Skewed returns |
For a strategy with occasional large winners and small, controlled losses, such as trend following, the Sortino ratio is usually much higher than the Sharpe ratio, and arguably fairer.
Comparing the two is informative. If your Sortino is much higher than your Sharpe, your volatility comes mostly from winning days, which is good. If they are close, your losses are a large part of your volatility. Combine them with maximum drawdown for a full picture.
Both ratios are on the statistics page, calculated from your daily returns, with metric history to see how they change. Related: the Sharpe ratio for traders.
How to calculate your average win and average loss, why their ratio matters as much as your win rate, and how to improve it.
Maximum adverse excursion (MAE) and maximum favorable excursion (MFE) reveal whether your stops are too tight and whether you exit winners too early. Here is how to use them.
How the Calmar ratio compares annual return with maximum drawdown, how to calculate it, what good values look like and when it is more useful than the Sharpe ratio.