Risk management
The Kelly Criterion for Traders: Optimal Bet Size and Its Dangers
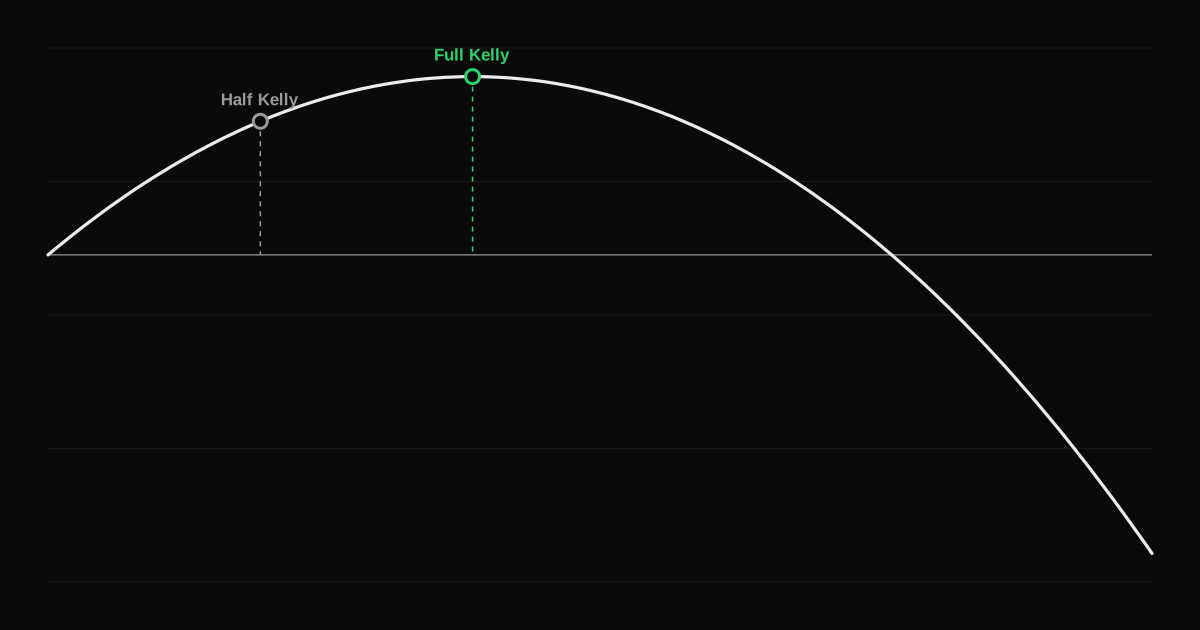
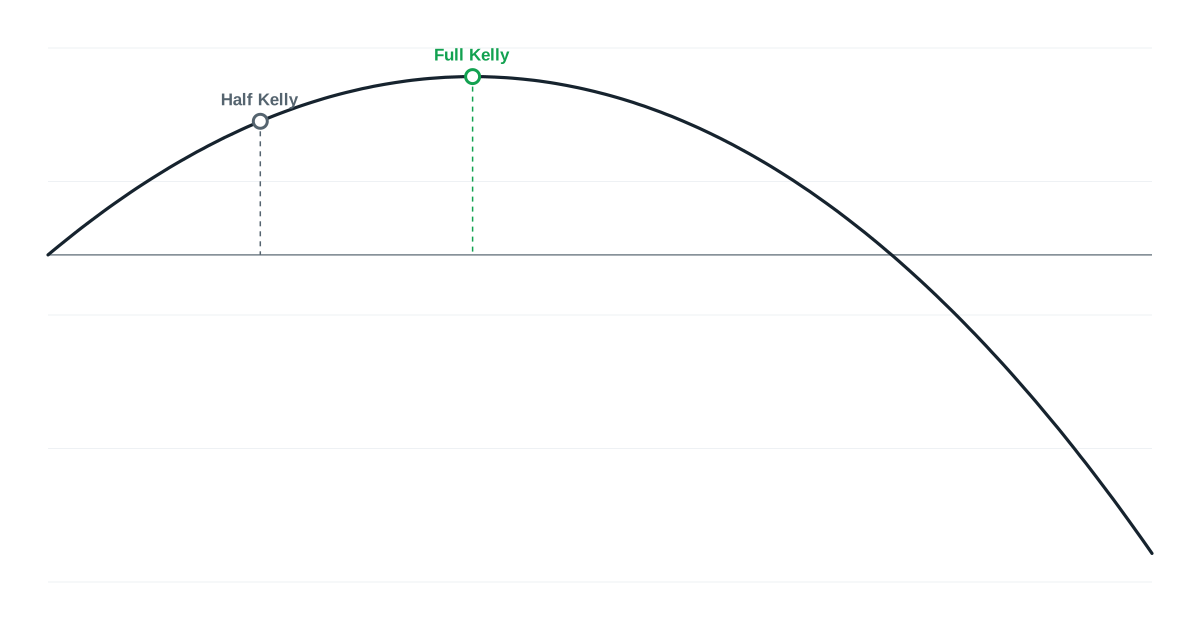
How the Kelly criterion calculates the bet size that maximizes long-term growth, how to apply it to trading, and why most traders use half Kelly or less.
What maximum drawdown is, how to calculate it, the gain needed to recover from each drawdown, and how to keep drawdowns small enough to survive.
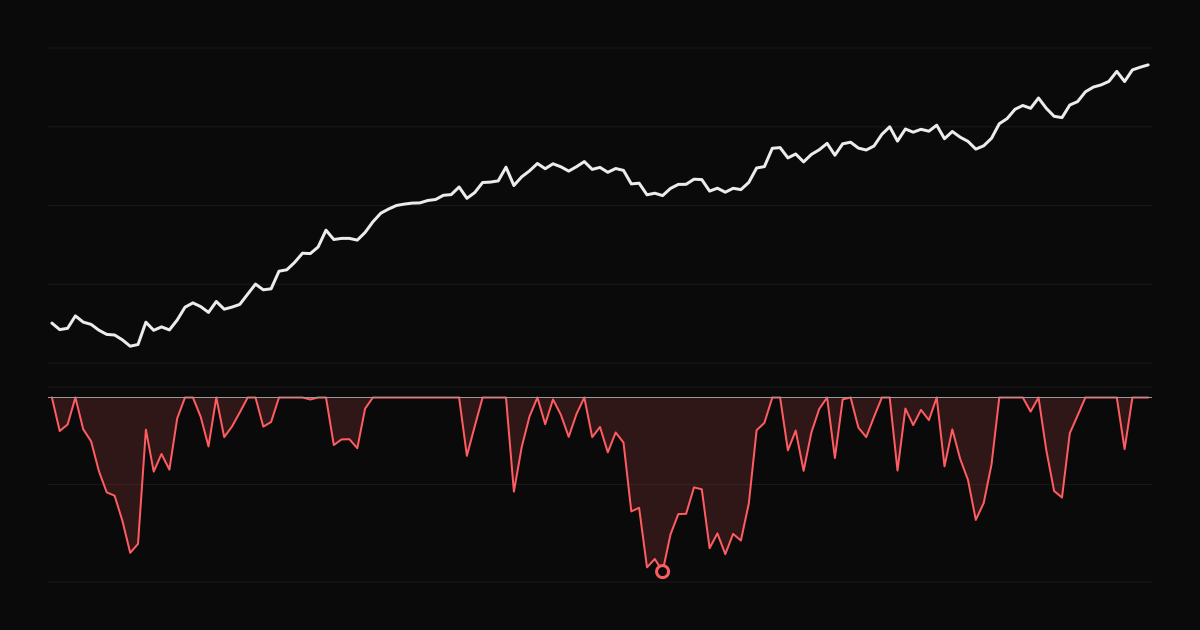
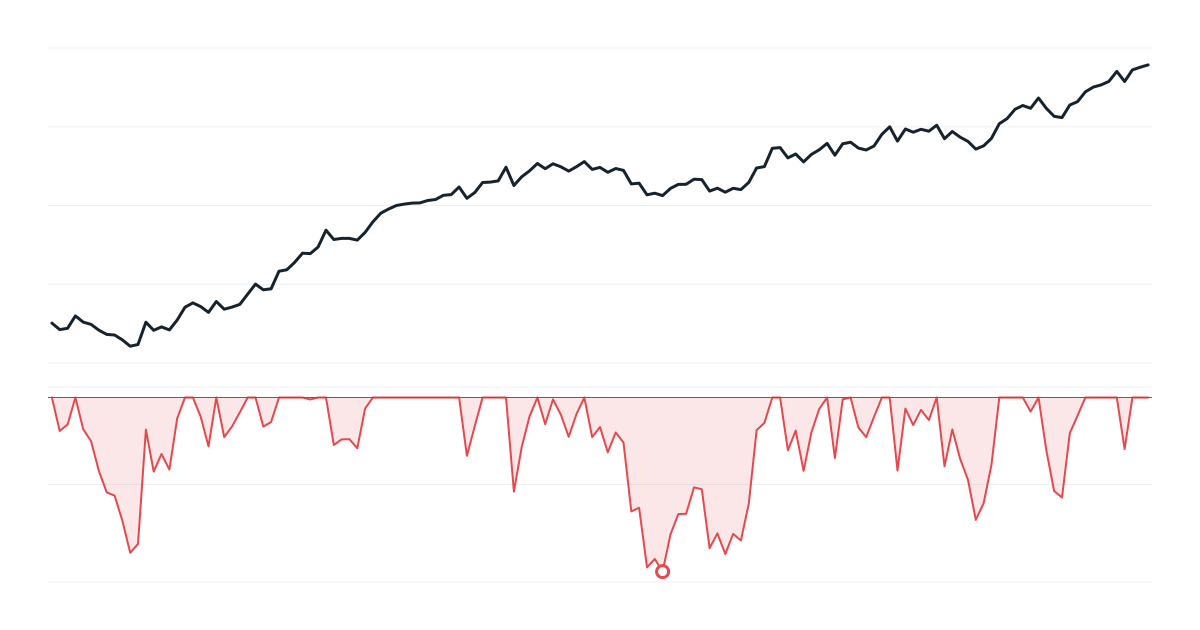
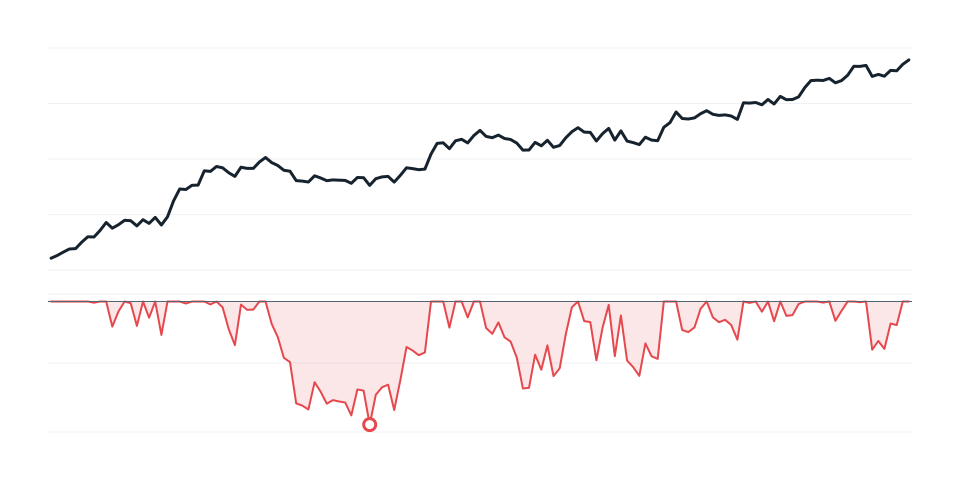
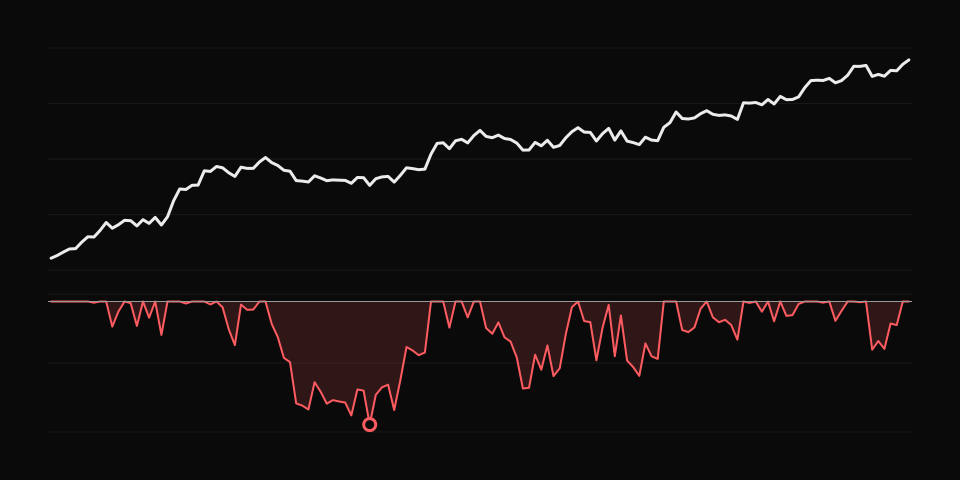
Drawdown measures how far your account has fallen from its highest point. Maximum drawdown is the largest such drop over a period. It is one of the most important numbers in trading, because it tells you the worst pain your strategy has delivered and how deep a hole you might have to climb out of.
Example: your account grows from $40,000 to $50,000, falls to $42,000, then recovers to $55,000. The maximum drawdown is ($42,000 − $50,000) ÷ $50,000 = −16%.
Losses and gains are not symmetrical. After a loss, you need a larger percentage gain to get back:
| Drawdown | Gain needed to recover |
|---|---|
| −10% | +11.1% |
| −20% | +25.0% |
| −30% | +42.9% |
| −40% | +66.7% |
| −50% | +100% |
| −75% | +300% |
This is the strongest argument for small risk per trade. A 10% drawdown is a bad month. A 50% drawdown can take years to recover from.
How long a drawdown lasts matters as well as how deep it is. A 15% drawdown that recovers in three weeks feels very different from one that lasts a year. Track the time from peak to new peak. The Ulcer index combines depth and duration in one number.
A strategy's return means little without its drawdown. The Calmar ratio compares annual return with maximum drawdown, and is a quick way to compare strategies with different risk levels.
Your equity curve, current drawdown and maximum drawdown are shown on the dashboard and statistics pages, along with the Calmar ratio and metric history, so you can see how deep and how long your drawdowns have been.
How the Kelly criterion calculates the bet size that maximizes long-term growth, how to apply it to trading, and why most traders use half Kelly or less.
How to set a daily loss limit for day trading, why it works, how big it should be, and how to make sure you actually stop when you hit it.
How to use the average true range (ATR) to set stop losses and position sizes that adapt to volatility, with formulas, multipliers and examples.