Average Win vs Average Loss: The Ratio Behind Every Profitable Trader
How to calculate your average win and average loss, why their ratio matters as much as your win rate, and how to improve it.
By the TradeThink team··3 min read
Your win rate tells you how often you win. Your average win and average loss tell you how much. The ratio between the two, sometimes called the payoff ratio, is half of your edge, and for many traders it is the half that needs the most work.
The calculation
Average win = Total profit from winning trades ÷ Number of winning trades
Average loss = Total loss from losing trades ÷ Number of losing trades
Payoff ratio = Average win ÷ Average loss
Example: 60 winners totaling $9,000 and 40 losers totaling $8,000.
Average win = $150
Average loss = $200
Payoff ratio = 0.75
With a 60% win rate and a 0.75 payoff ratio, expectancy is 0.6 × $150 − 0.4 × $200 = +$10 per trade. Positive, but thin. See expectancy.
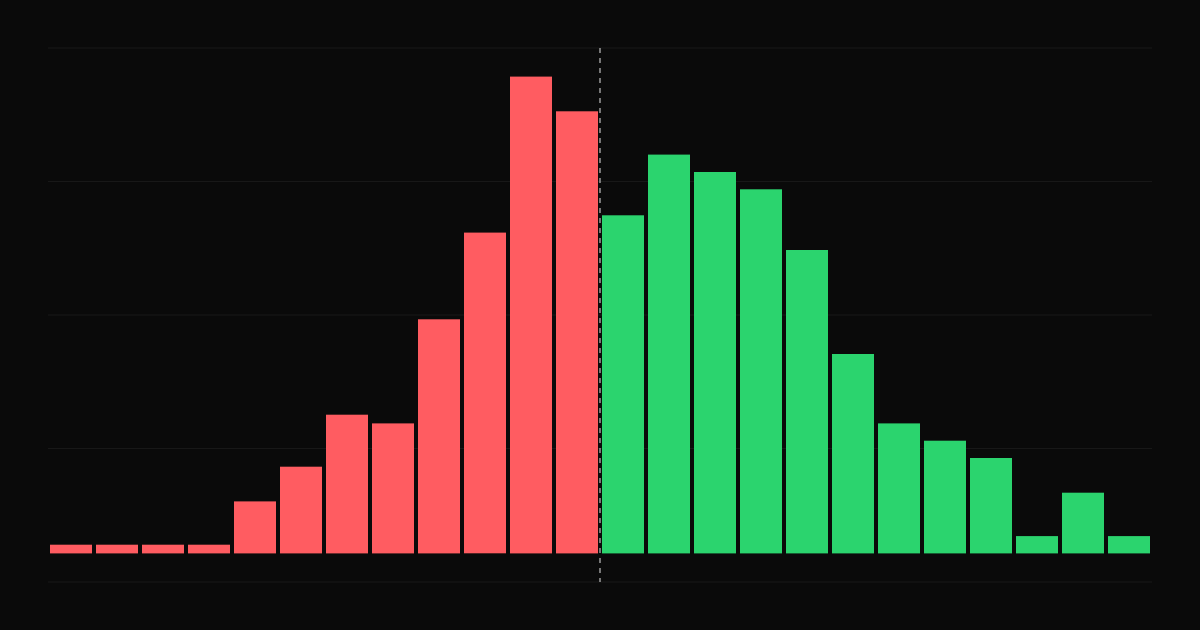
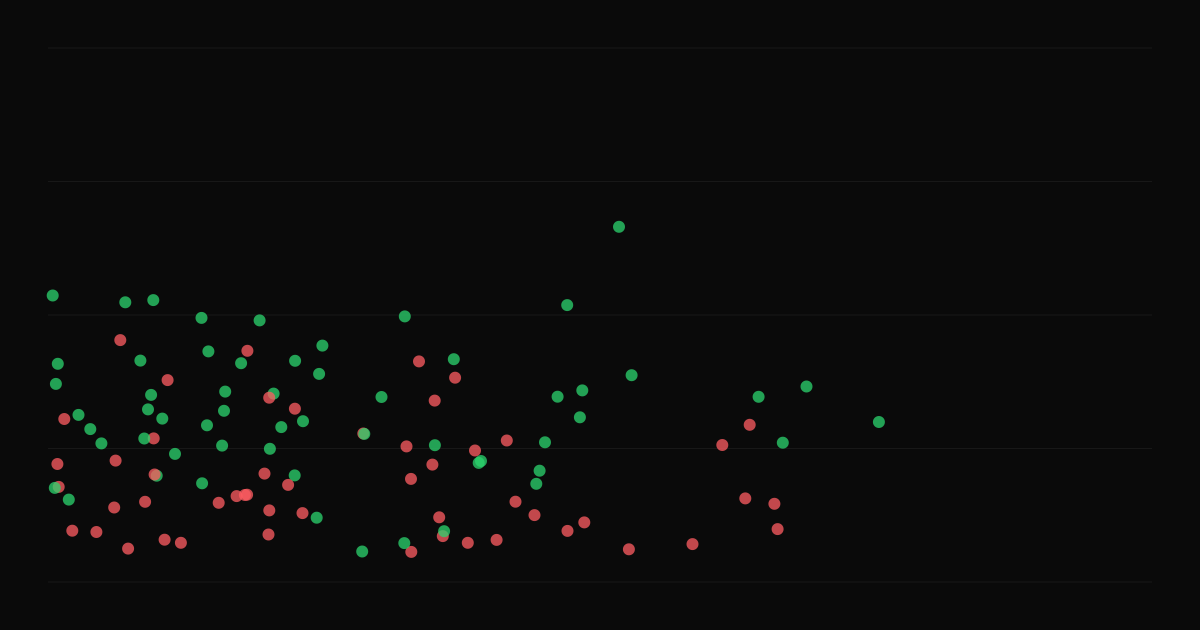
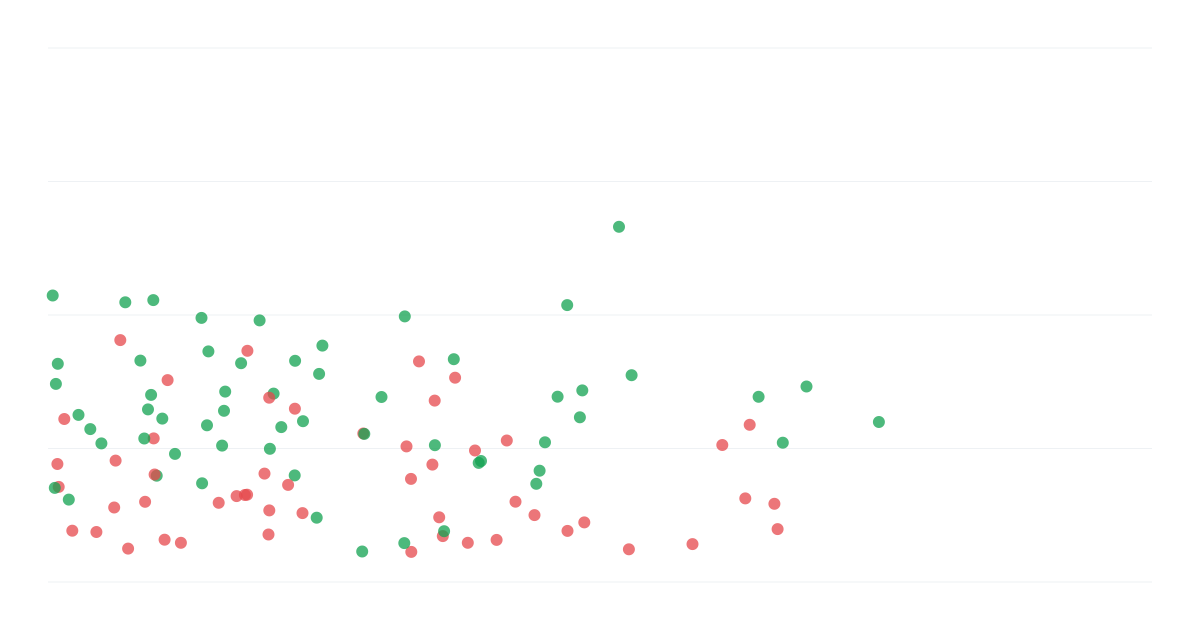
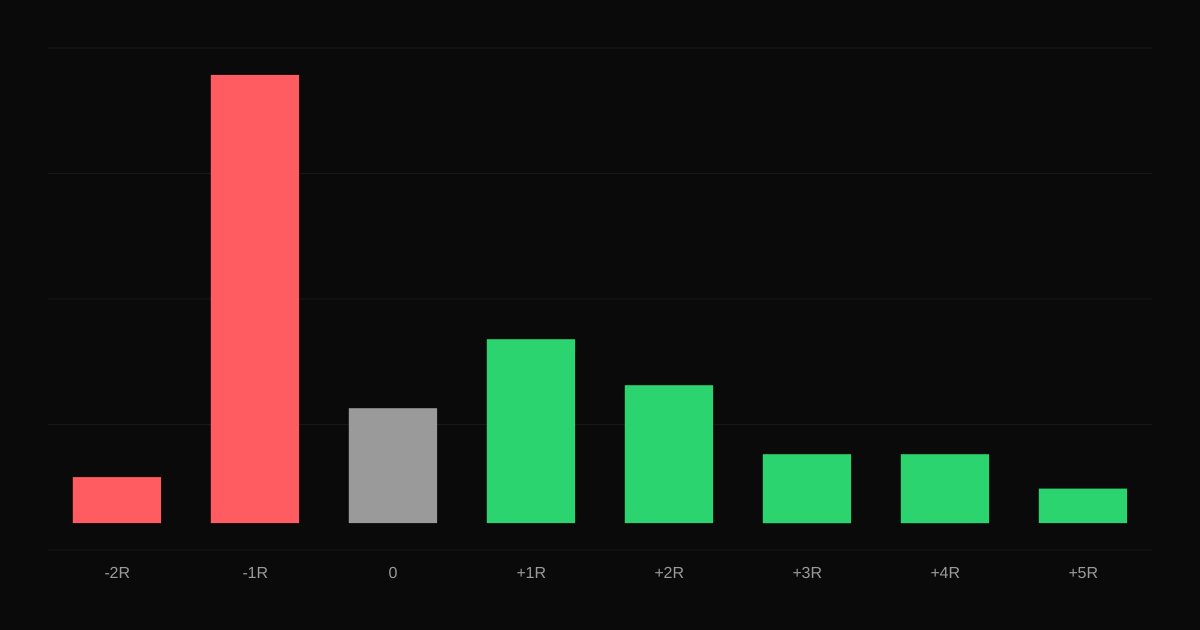
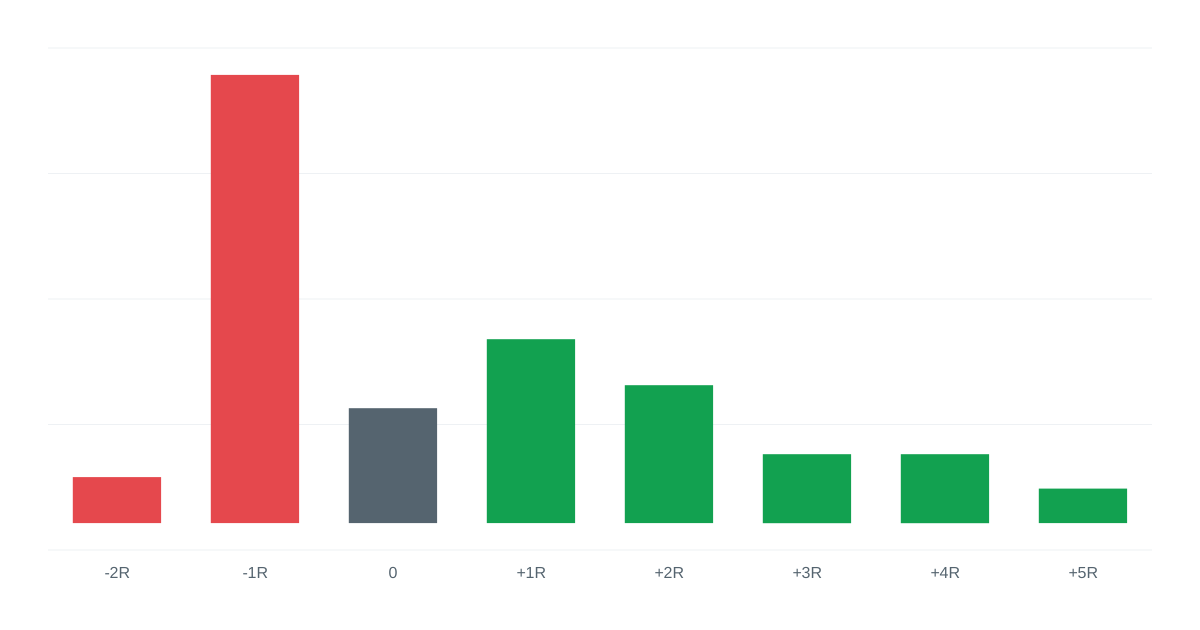
Average win and average loss summarize the two sides of this distribution.
What the ratio tells you
Below 1: you need a high win rate to profit. Check whether losses are bigger than planned.
Around 1: you need to win more than half the time.
Above 1.5: you can be profitable with a modest win rate.
The break-even win rate for any payoff ratio is 1 ÷ (1 + ratio). See risk-reward ratio.
Look at the largest too
Averages can hide outliers. Check your largest win and largest loss. If your largest loss is five times your average loss, a few disasters are dragging your results down. If your largest win is a big share of total profit, your results depend on rare events.
In R-multiples, a disciplined trader's average loss should be close to −1R. If yours is −1.4R, there is easy money to recover by fixing exits. See R-multiples.
In TradeThink
Average win, average loss, largest win and loss and the payoff ratio are shown on the statistics page for any set of filtered trades, along with the full P&L distribution.
Maximum adverse excursion (MAE) and maximum favorable excursion (MFE) reveal whether your stops are too tight and whether you exit winners too early. Here is how to use them.
How the Calmar ratio compares annual return with maximum drawdown, how to calculate it, what good values look like and when it is more useful than the Sharpe ratio.