Performance metrics
The Calmar Ratio: Return Compared With Your Worst Drawdown
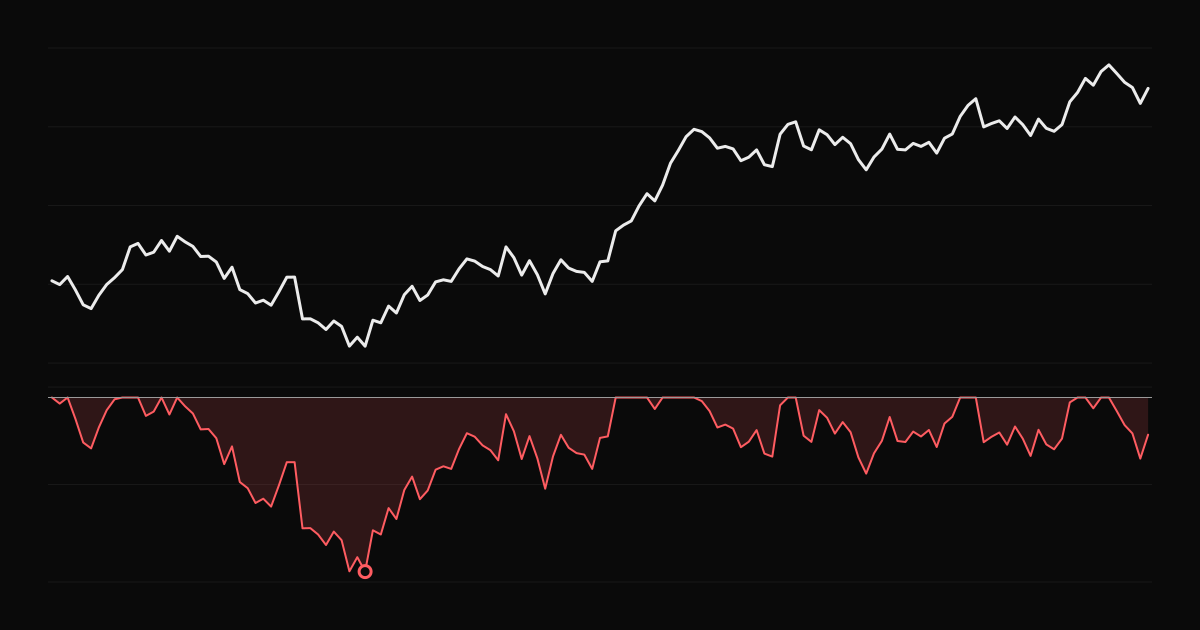
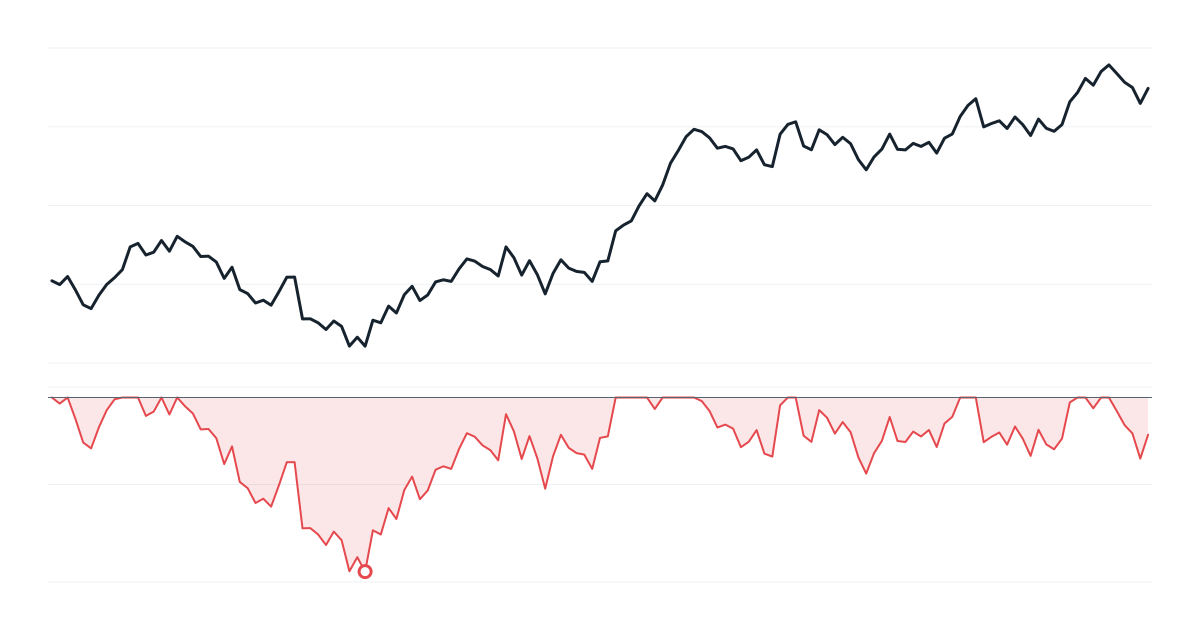
How the Calmar ratio compares annual return with maximum drawdown, how to calculate it, what good values look like and when it is more useful than the Sharpe ratio.
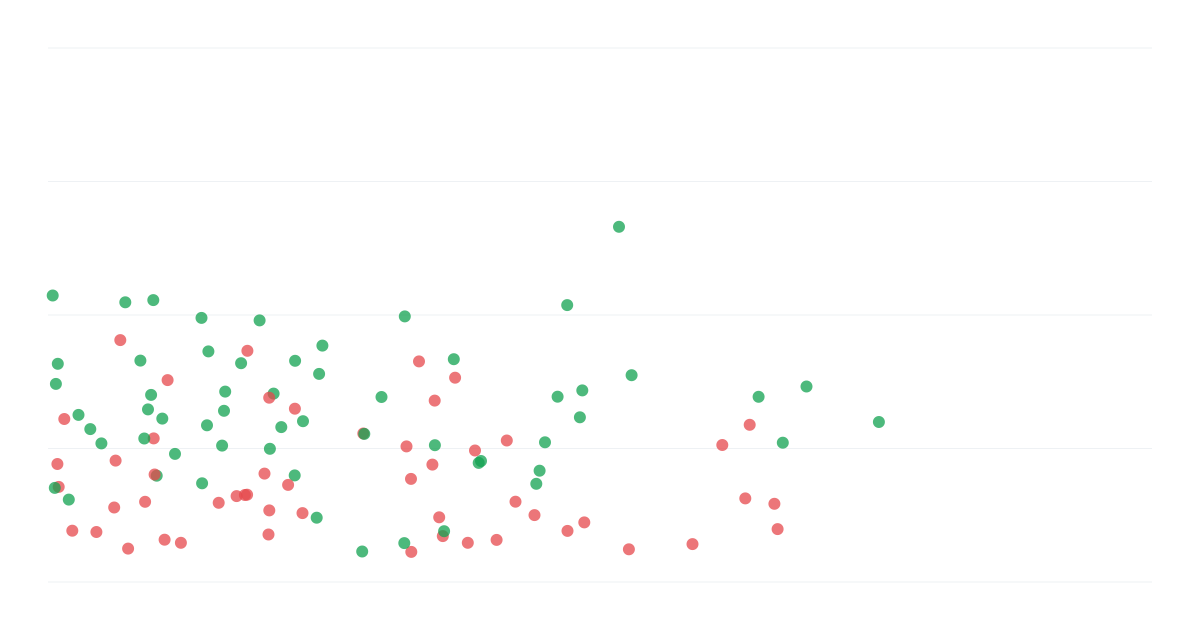
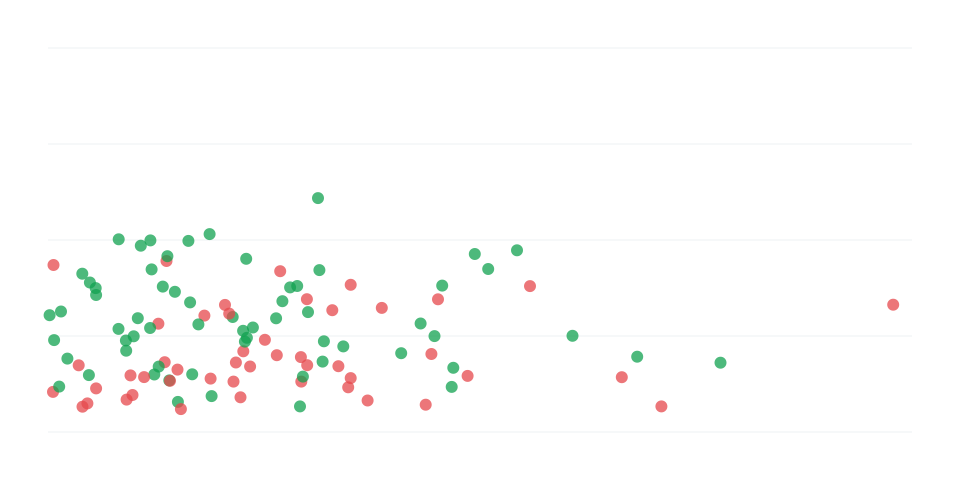
Maximum adverse excursion (MAE) and maximum favorable excursion (MFE) reveal whether your stops are too tight and whether you exit winners too early. Here is how to use them.
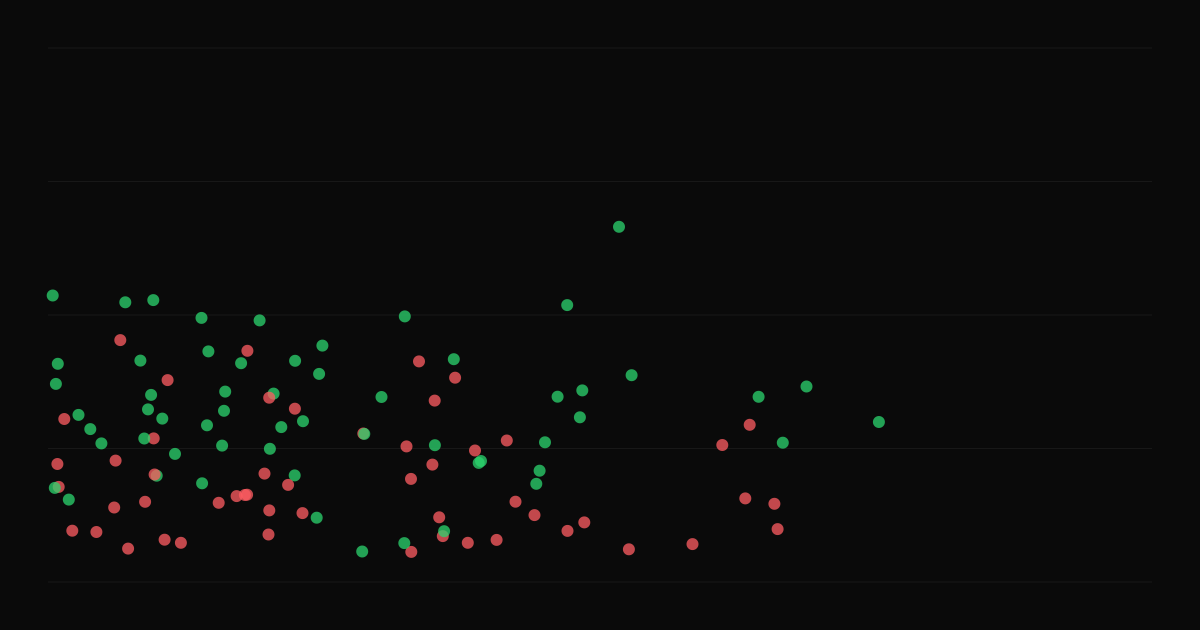
Your P&L shows where a trade ended. It does not show the path it took. Two measures, popularized by John Sweeney, fill that gap: MAE, the maximum adverse excursion, and MFE, the maximum favorable excursion.
Both are usually measured from your entry price, in dollars, points or R.
Example: you buy at $50 with a stop at $48. The stock dips to $48.80, rallies to $54, and you exit at $52.
You captured half of the available move.
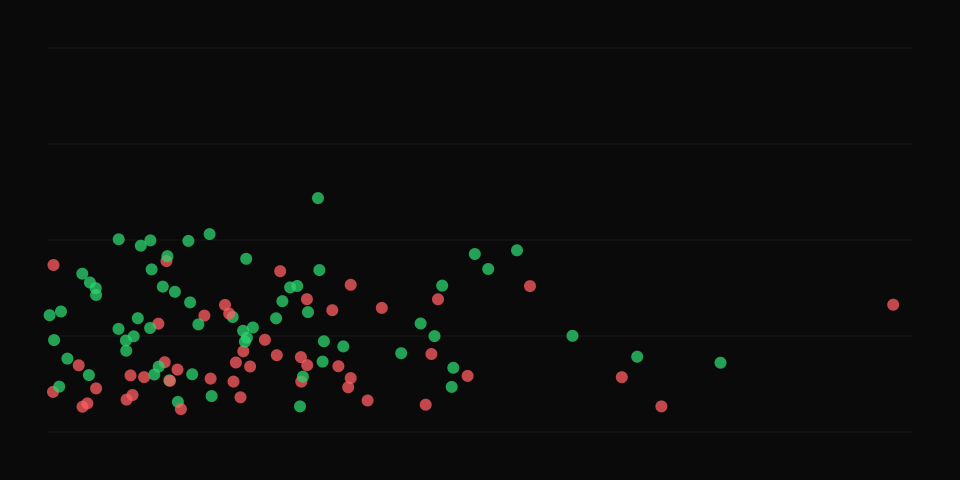
Look at the MAE of your winning trades. If almost no winners went more than 0.5R against you, a stop at 1R may be wider than you need. If many winners went 0.9R against you before working, your stop is right at the edge of normal noise, and a slightly wider stop might save trades.
Look at the MAE of your losing trades. If many losers went far beyond 1R before you exited, you are not honoring your stops. See stop-loss placement.
Look at the MFE of your winners. If they often reached 2R or 3R but you exited around 1R, you are cutting winners early. A target or trailing stop may help.
Look at the MFE of your losers. If many losing trades were up 1R at some point before reversing to a full loss, consider moving your stop to break-even after +1R, or taking partial profit there. See scaling in and out.
Some traders track exit efficiency: the result divided by MFE. Capturing 50% to 70% of the favorable move on winners is often considered good for discretionary traders. Very low efficiency points to exit problems.
MAE and MFE require price data during each trade, which is hard to collect by hand. Journals that fetch intraday prices can compute them automatically.
Each trade's price chart shows the bars between entry and exit with your executions marked, so you can see the path of every trade. Review your largest winners and losers this way during your weekly review.
How the Calmar ratio compares annual return with maximum drawdown, how to calculate it, what good values look like and when it is more useful than the Sharpe ratio.
What the System Quality Number is, how to calculate it from your R-multiples, how to read the scores, and the pitfalls of using it on small samples.
Your equity curve tells the story of your trading. Learn to read slope, smoothness, drawdowns, step changes and flat periods, and what each one suggests you should do.