Performance metrics
How to Read Your Equity Curve: 6 Patterns and What They Mean
Your equity curve tells the story of your trading. Learn to read slope, smoothness, drawdowns, step changes and flat periods, and what each one suggests you should do.
What the System Quality Number is, how to calculate it from your R-multiples, how to read the scores, and the pitfalls of using it on small samples.
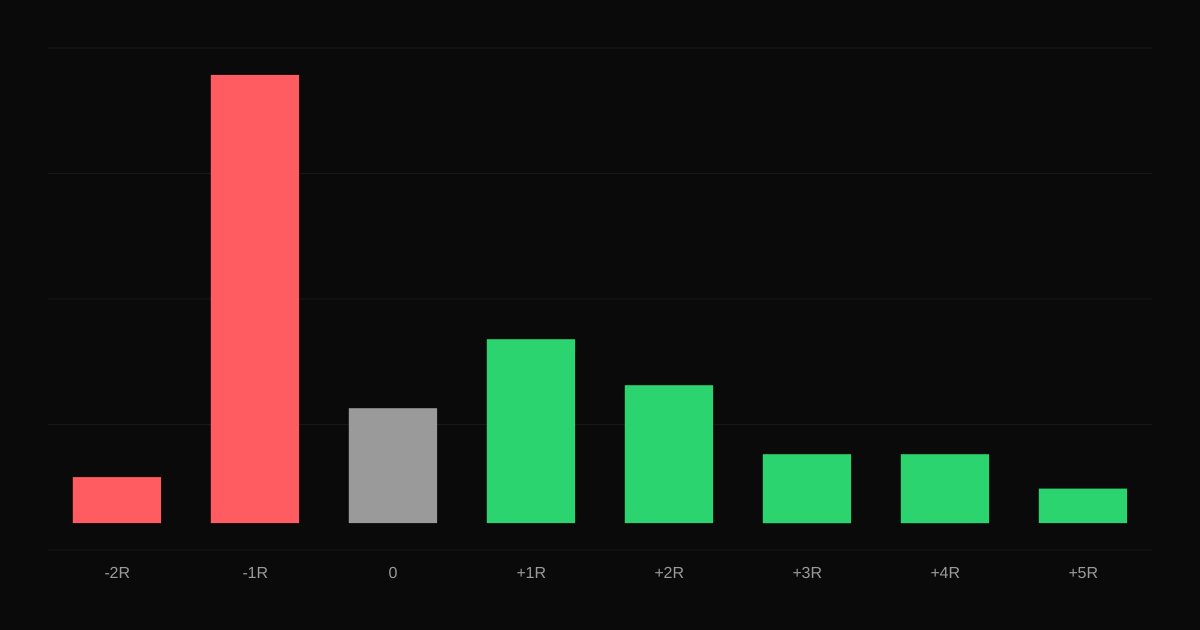
The System Quality Number (SQN), developed by Van K. Tharp, combines your average result per trade, the consistency of those results and the number of trades into one score. It is a way to ask: how reliable is this edge?
SQN uses your trades' R-multiples:
SQN = √N × (Average R ÷ Standard deviation of R)
where N is the number of trades. Tharp suggested capping N at 100 when comparing systems, so that a large number of trades does not inflate the score on its own.
Example: 100 trades, average +0.3R, standard deviation 1.5R.
SQN = √100 × (0.3 ÷ 1.5) = 10 × 0.2 = 2.0.
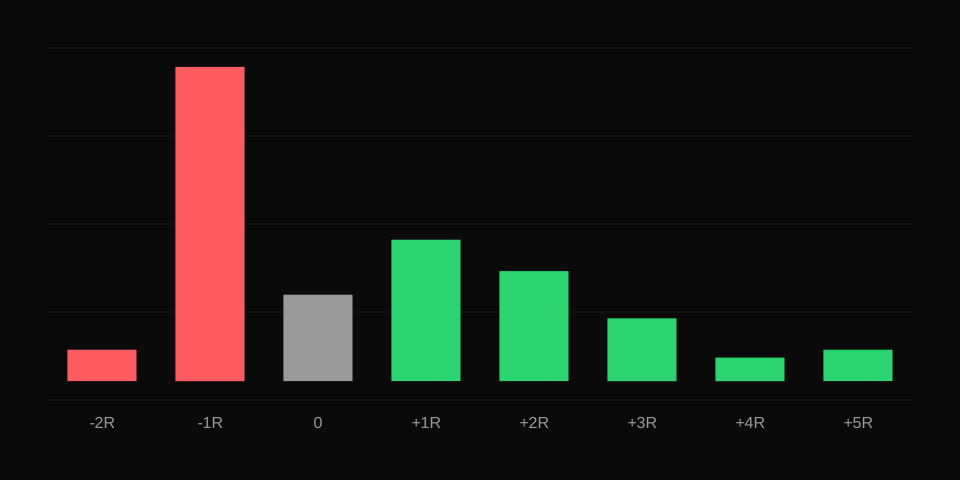
Tharp's commonly quoted guide:
| SQN | Rating |
|---|---|
| Below 1.6 | Poor, hard to trade |
| 1.6 to 2.0 | Average |
| 2.0 to 2.5 | Good |
| 2.5 to 3.0 | Excellent |
| 3.0 to 5.0 | Superb |
| Above 5.0 | Holy grail, or too few trades |
It is closely related to a t-statistic: it asks how many standard errors the average result is above zero.
SQN is most useful for comparing setups or versions of a strategy using your own data. A setup with SQN 2.5 over 100 trades deserves more capital and attention than one with SQN 1.2.
SQN is calculated on the statistics page along with expectancy in R, and you can filter by setup to compare. Related: expectancy.
Your equity curve tells the story of your trading. Learn to read slope, smoothness, drawdowns, step changes and flat periods, and what each one suggests you should do.
How to measure whether your trading is consistent, using winning days and weeks, the share of profit from your best days, monthly results and streaks.
Why small samples mislead traders, how the number of trades affects the reliability of win rate and expectancy, and how to use Monte Carlo simulation to test your edge.