Performance metrics
Measuring Trading Consistency: Beyond Total Profit
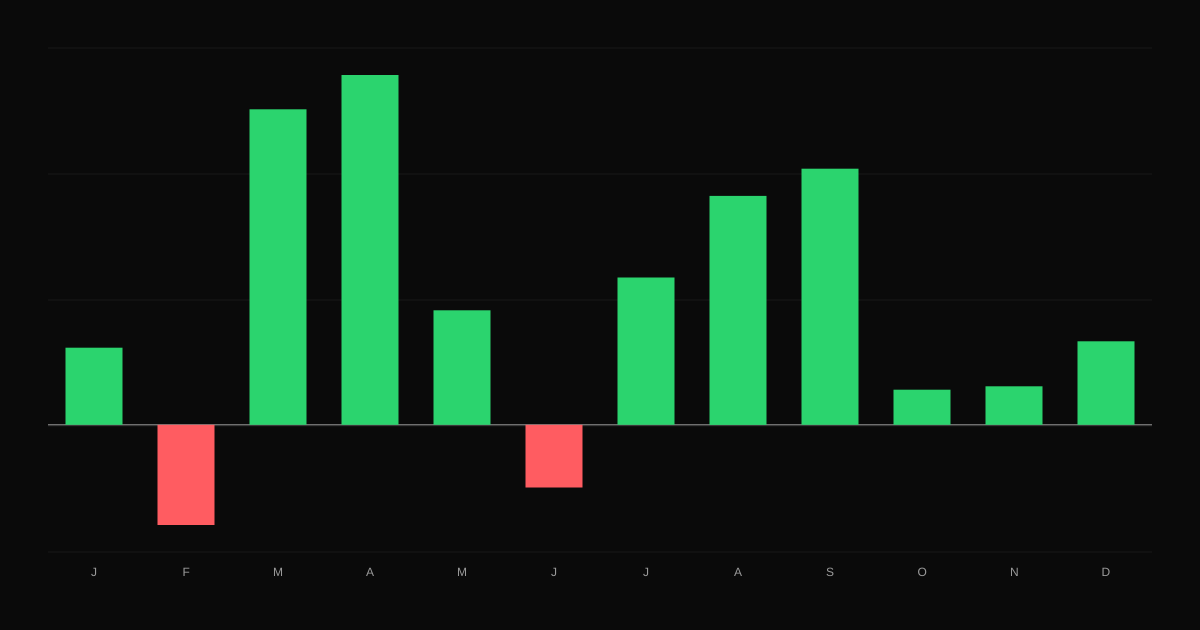
How to measure whether your trading is consistent, using winning days and weeks, the share of profit from your best days, monthly results and streaks.
Your equity curve tells the story of your trading. Learn to read slope, smoothness, drawdowns, step changes and flat periods, and what each one suggests you should do.
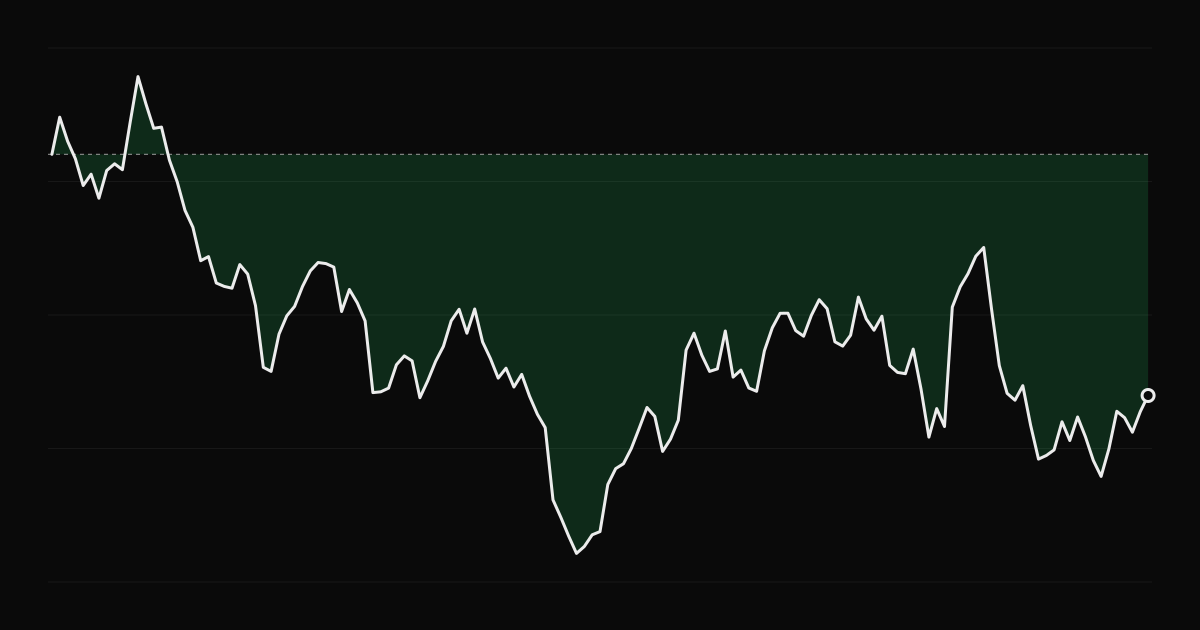
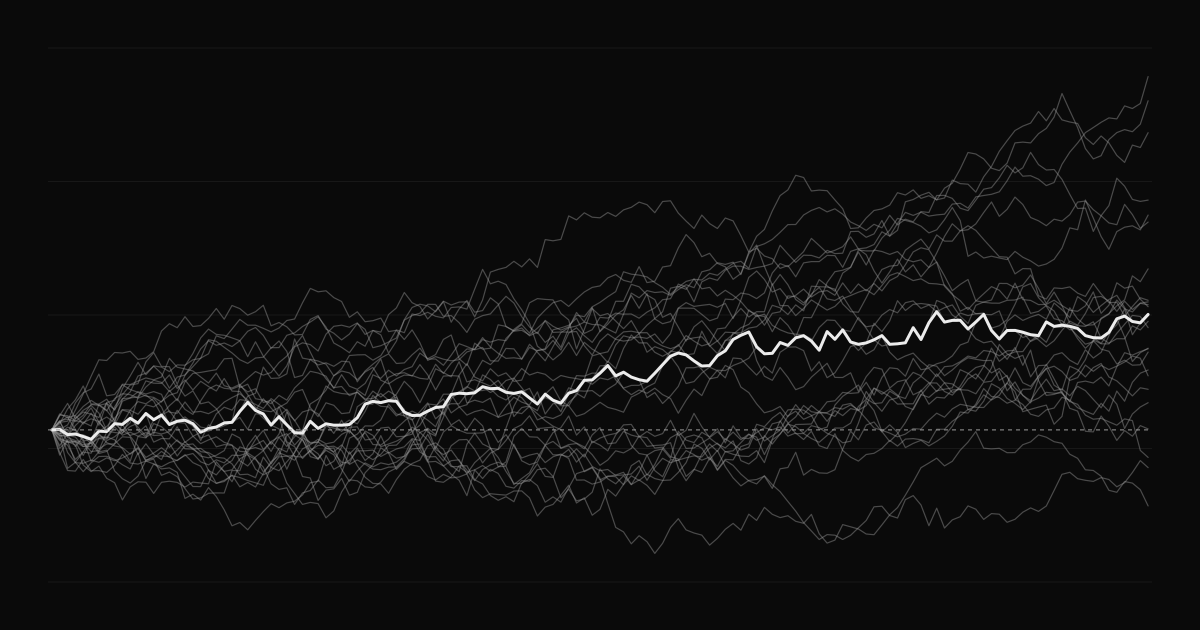
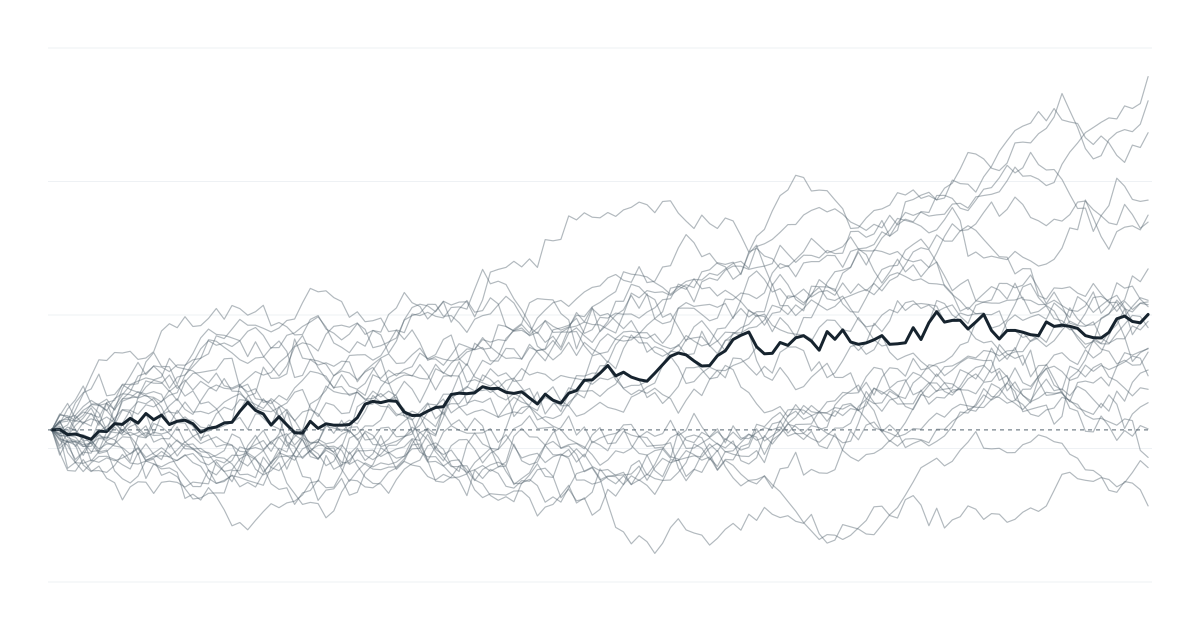
The equity curve, your cumulative P&L over time, is the single most informative chart in your journal. Its shape says more than any one number: whether your edge is steady, whether risk is under control, and when something changed.
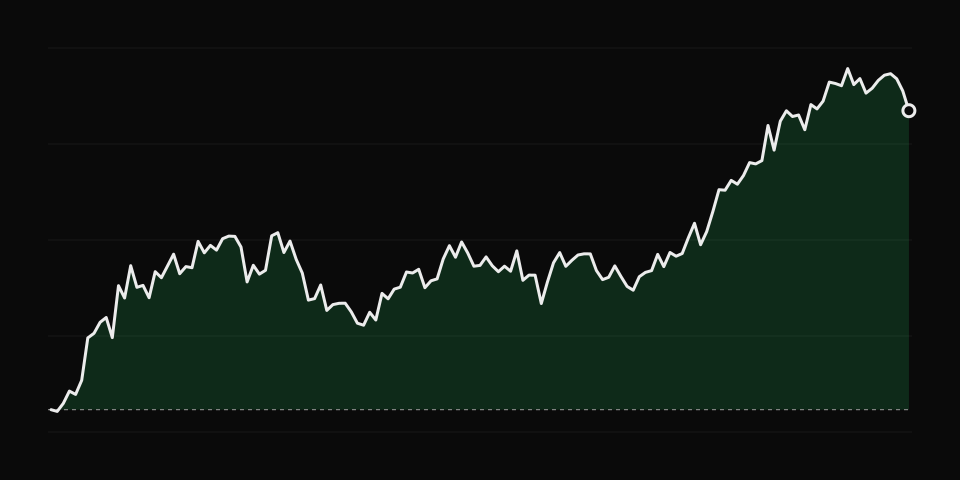
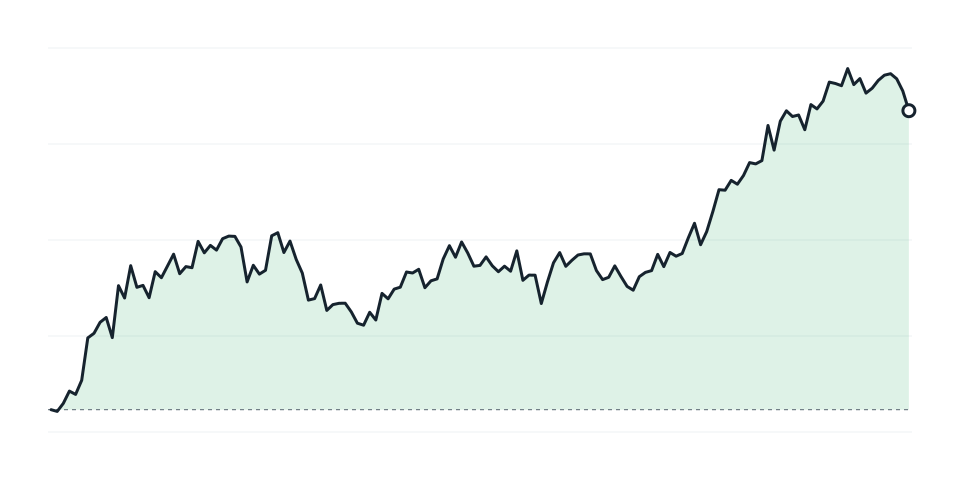
The ideal. Gains accumulate with shallow, short drawdowns. Keep doing what you are doing, and resist the urge to suddenly increase size. See overconfidence after a big win.
The curve moves in large jumps. A few trades decide the result. This usually means inconsistent position sizing or rare, large wins and losses. Check whether your risk per trade is consistent. See position sizing.
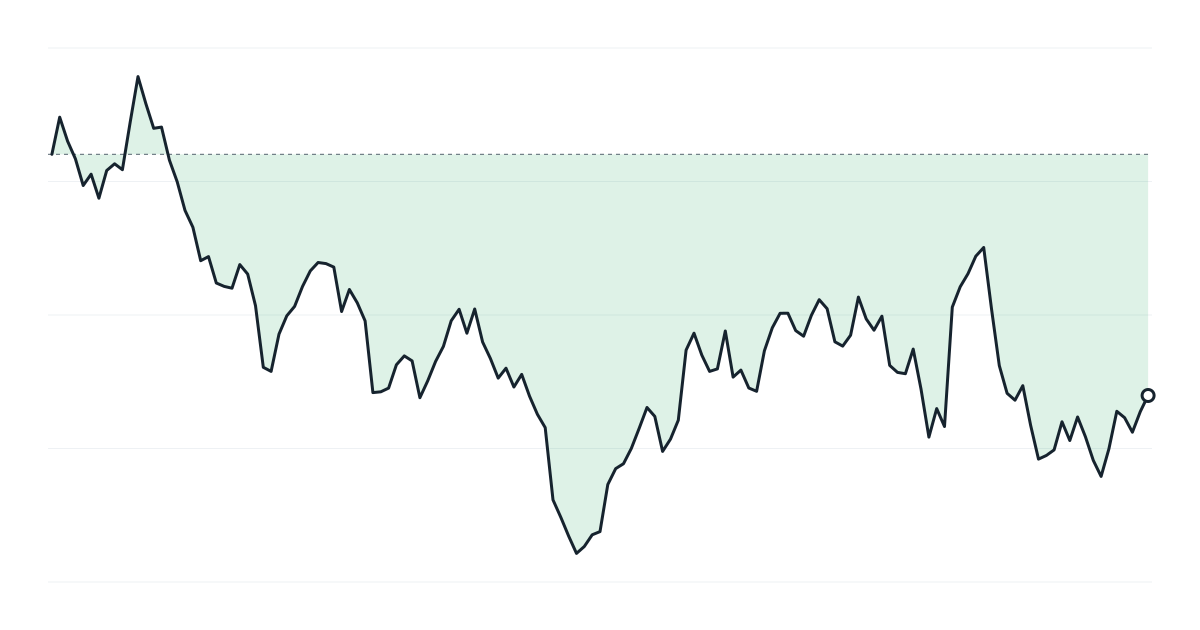
Slow, steady gains wiped out by one or two sharp drops. This is the classic signature of holding losers, averaging down or selling options without defined risk. The fix is in your risk rules, not your entries. See loss aversion and daily loss limit.
The curve goes sideways for weeks or months. Either the market has changed and your setups are not working, or your costs are eating a small edge. Check results by setup and look at fees. See commissions and fees.
The curve was rising and has flattened or turned down, starting at a specific point. Find that date and ask what changed: a new setup, a bigger size, a new market regime, something in your life. Your journal entries from that week are the place to look.
A drawdown much deeper or longer than any before. Compare it with your history. If it is beyond what your past results would suggest, reduce size and review. See handling a losing streak.
A curve in dollars mixes your edge with your position size. If you increased size over time, the curve will look better than your trading was. Plotting cumulative R shows the underlying edge.
Below the equity curve, plot the drawdown at each point. The underwater chart makes the depth and duration of drawdowns obvious. See maximum drawdown.
If you deposited money during the period, your balance rose but your trading did not. An equity curve for analysis should show trading P&L, not account balance. See cash flow in your trading account.
The dashboard shows your cumulative P&L curve with a free-moving crosshair, the reports include drawdown charts, and you can filter the curve by setup, side or account to see which part of your trading is driving it.
How to measure whether your trading is consistent, using winning days and weeks, the share of profit from your best days, monthly results and streaks.
Why small samples mislead traders, how the number of trades affects the reliability of win rate and expectancy, and how to use Monte Carlo simulation to test your edge.
How analyzing trade duration reveals hidden habits, why many traders hold losing trades longer than winners, and how to use holding time to improve exits.