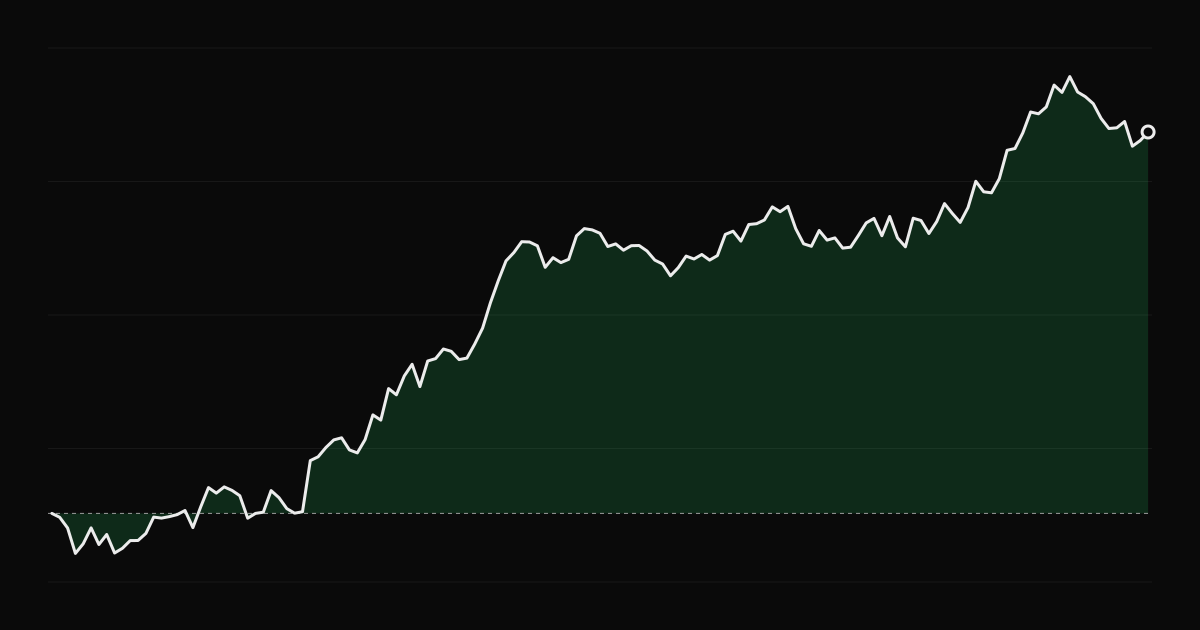
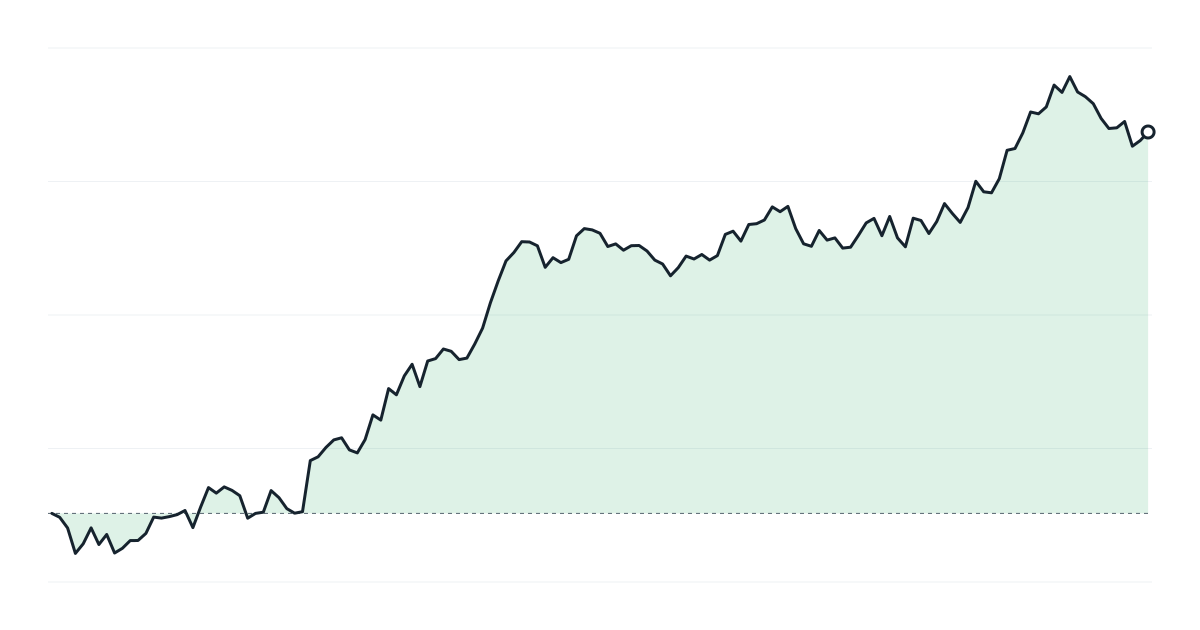
Measuring Trading Consistency: Beyond Total Profit
How to measure whether your trading is consistent, using winning days and weeks, the share of profit from your best days, monthly results and streaks.
By the TradeThink team··3 min read
Two traders each make $20,000 in a year. One made it steadily, month after month. The other made $35,000 in two months and lost $15,000 over the other ten. The total is the same; the trading is not. Consistency metrics show the difference.
Metrics worth tracking
Percentage of winning days and weeks
Count days with positive P&L as a share of all trading days. Do the same for weeks. Weekly figures are often more meaningful for day traders, because individual days are noisy.
Best day as a share of total profit
Divide your single best day by your total profit for the period. If one day is 40% of your annual profit, your results depend on rare events. Some prop firms use a rule like this, requiring that no single day is more than a set share of total profit. See prop firm rules.
Monthly results
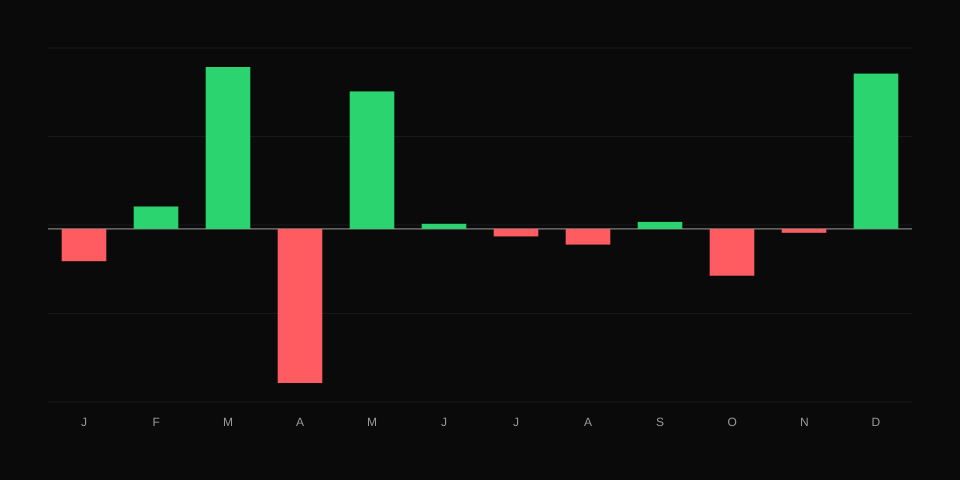
How many months were profitable? How big was the worst month compared with the average month?
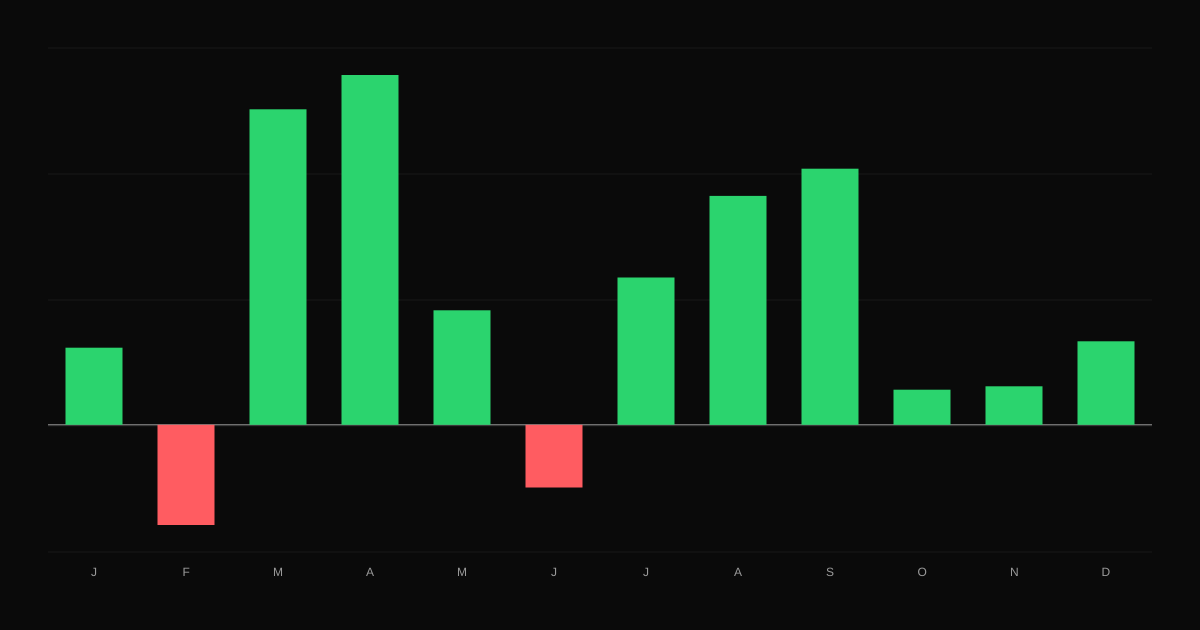
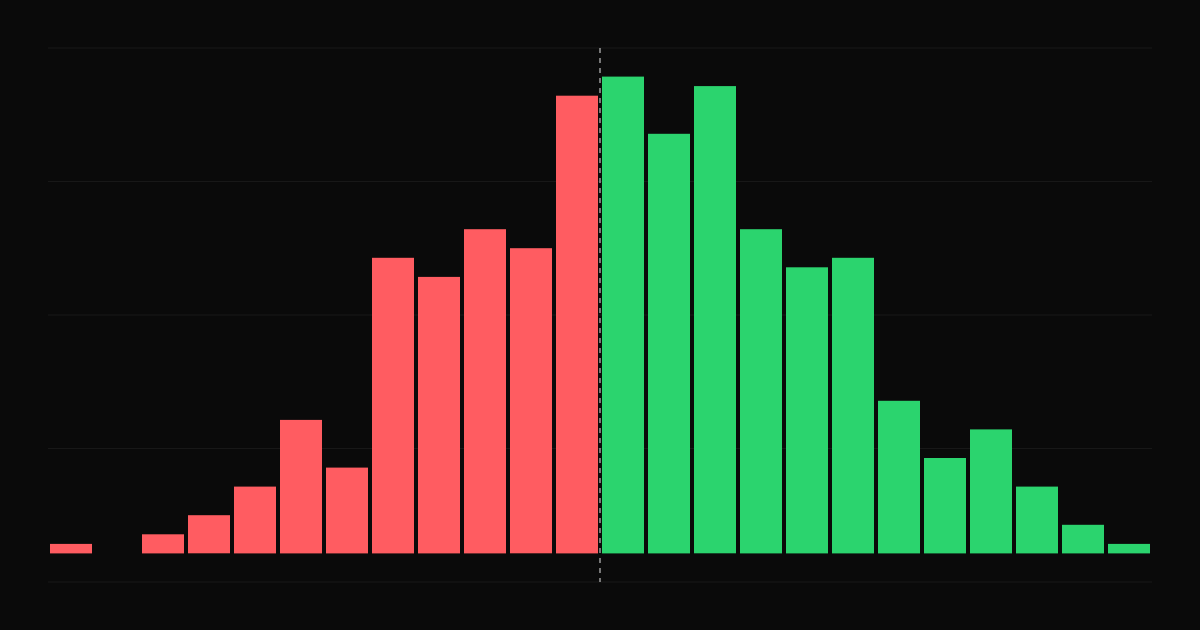
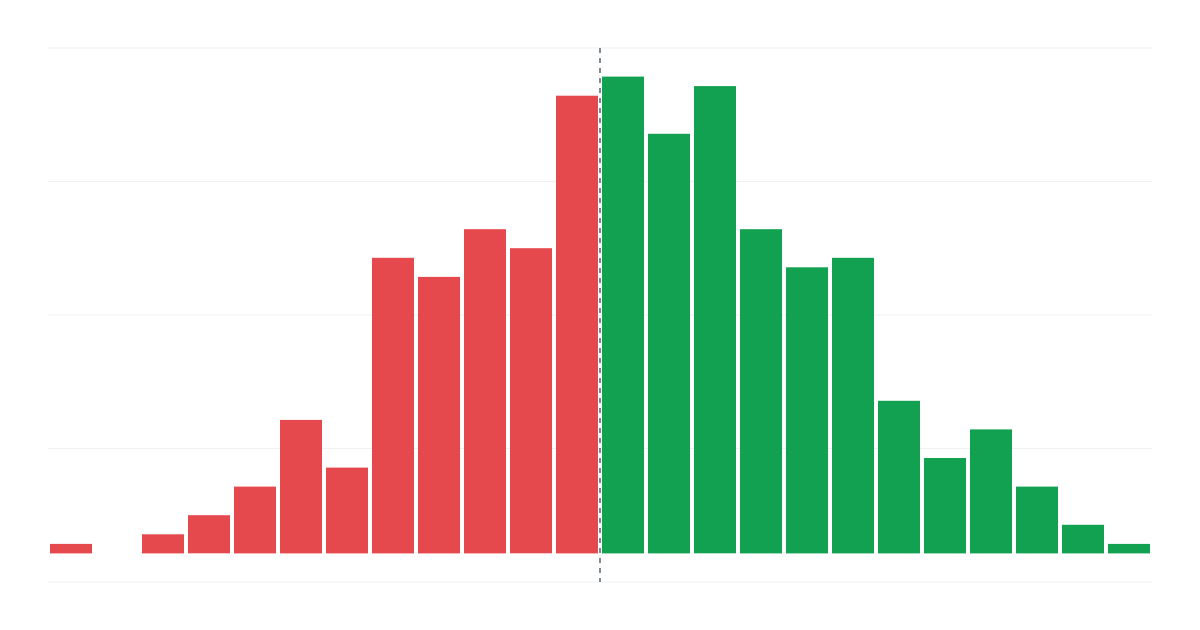
Monthly results. Consistent traders show mostly green bars of similar height.
How much your daily results vary. Lower variation for the same average means smoother results, which is what the Sharpe ratio captures.
Why consistency matters
It is evidence of skill. Steady results over many periods are harder to get by luck than one big period.
It is easier to live with. Smooth results make it easier to follow your rules.
It scales better. Steady strategies can usually take more size without unbearable drawdowns.
How to improve it
Reduce the variance of your losses: consistent stops and sizing.
Cut the outlier days with a daily loss limit.
Trade the same setups, in the same hours, at the same size. See best trading hours.
In TradeThink
The calendar shows daily and weekly results, the reports break results down by month, and the statistics include winning days, best and worst days and streaks. Related: monthly performance review.
Why small samples mislead traders, how the number of trades affects the reliability of win rate and expectancy, and how to use Monte Carlo simulation to test your edge.
How analyzing trade duration reveals hidden habits, why many traders hold losing trades longer than winners, and how to use holding time to improve exits.
How commissions, exchange fees, spreads and slippage add up, how to calculate their impact on your edge, and practical ways to keep trading costs under control.