Risk management
Correlation Risk: When Five Trades Are Really One
How correlated positions multiply your risk, how to spot hidden correlation across stocks, sectors, currencies and crypto, and how to size around it.
What R-multiples are, how to calculate them, and why measuring trades in units of risk makes your results comparable, honest and easier to improve.
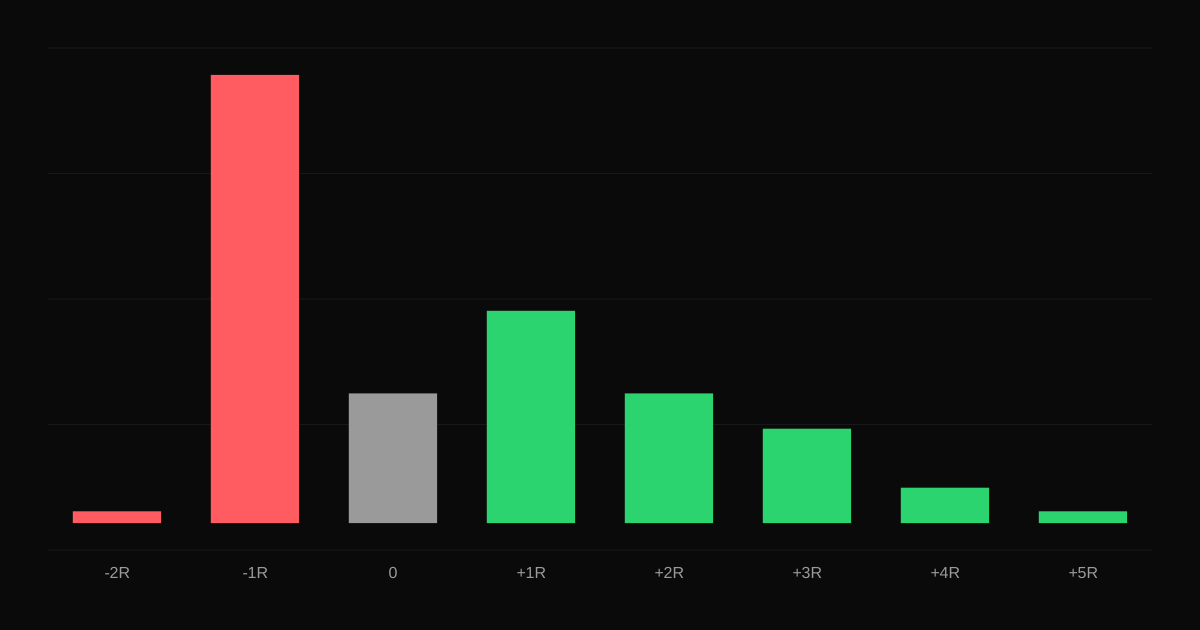
A $300 profit sounds good. But was it a $300 profit on $100 of risk or on $1,000? R-multiples answer that question by measuring every trade in units of what you risked. The idea was popularized by Van K. Tharp, and it is one of the most useful habits a trader can adopt.
R is the amount you planned to risk on a trade: the distance from entry to stop, times your size.
R-multiple = Profit or loss ÷ Initial risk
Examples, with $200 of planned risk:
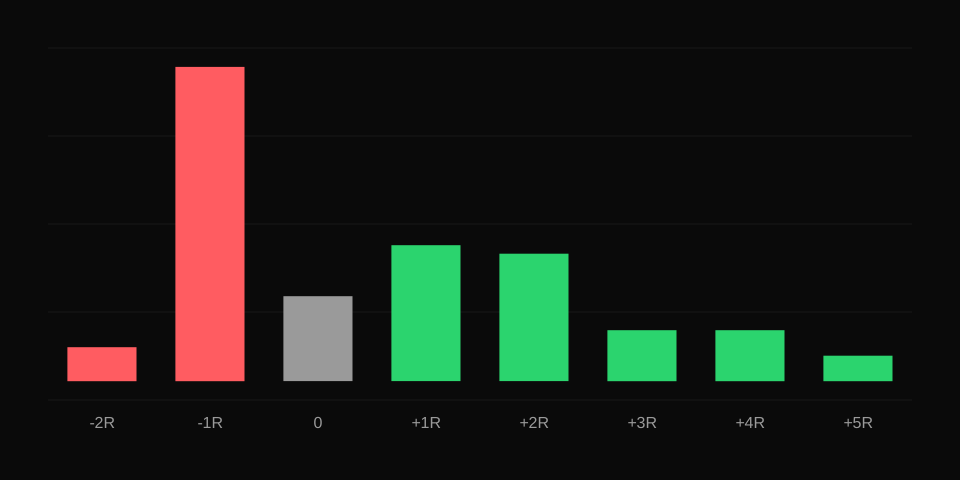
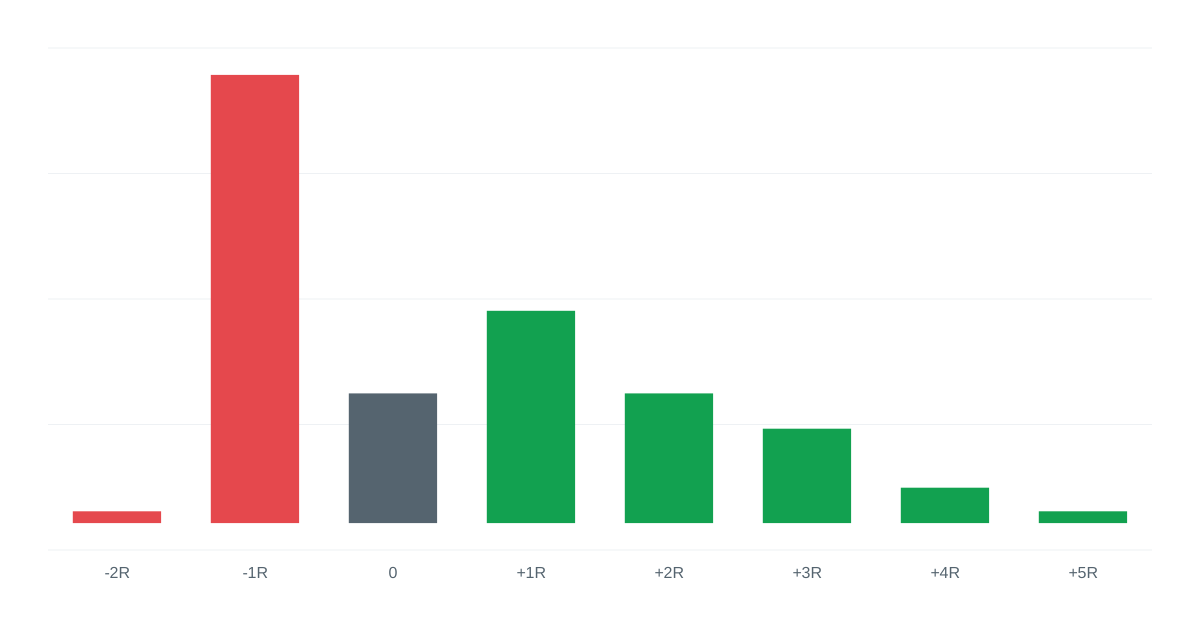
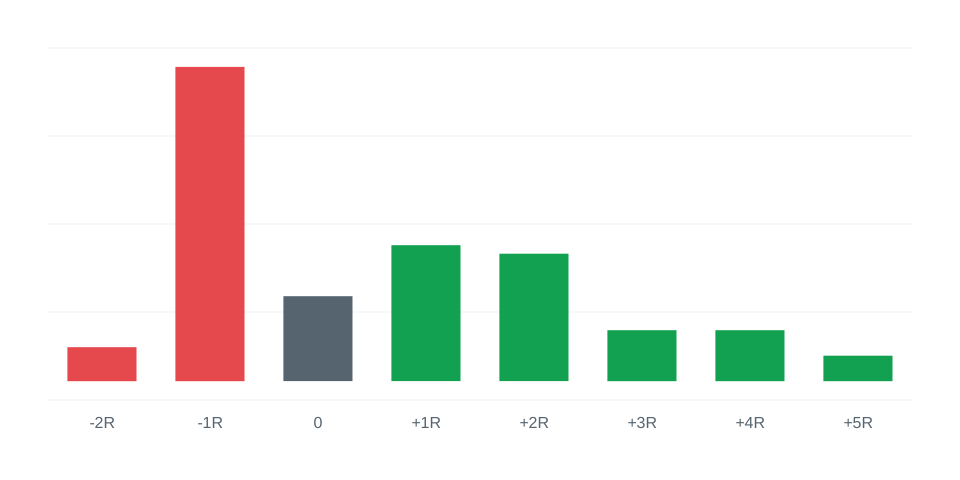
Plot all your trades by R-multiple. A healthy distribution often has:
Warning signs:
To calculate R, you need the planned stop for each trade. Record it at entry. Without it, you cannot know your risk. If you trade without fixed stops, you can use a consistent proxy, such as a fixed dollar amount, but a real stop is better.
Once your trades are in R, you can calculate the System Quality Number, which combines the average R and its consistency into one score. See also the risk-reward ratio.
Record a stop for each trade and TradeThink calculates its R-multiple, then shows your average R, expectancy and R distribution in the statistics. Filters let you compare R by setup, so you can see which setups have a real edge.
How correlated positions multiply your risk, how to spot hidden correlation across stocks, sectors, currencies and crypto, and how to size around it.
How leverage and margin work in stocks, futures, forex and CFDs, how margin calls happen, and how to think about leverage in terms of risk rather than buying power.
How trailing stops work, the main methods (percentage, ATR, structure and moving average), and how to choose one that fits your strategy.